1
\$\begingroup\$

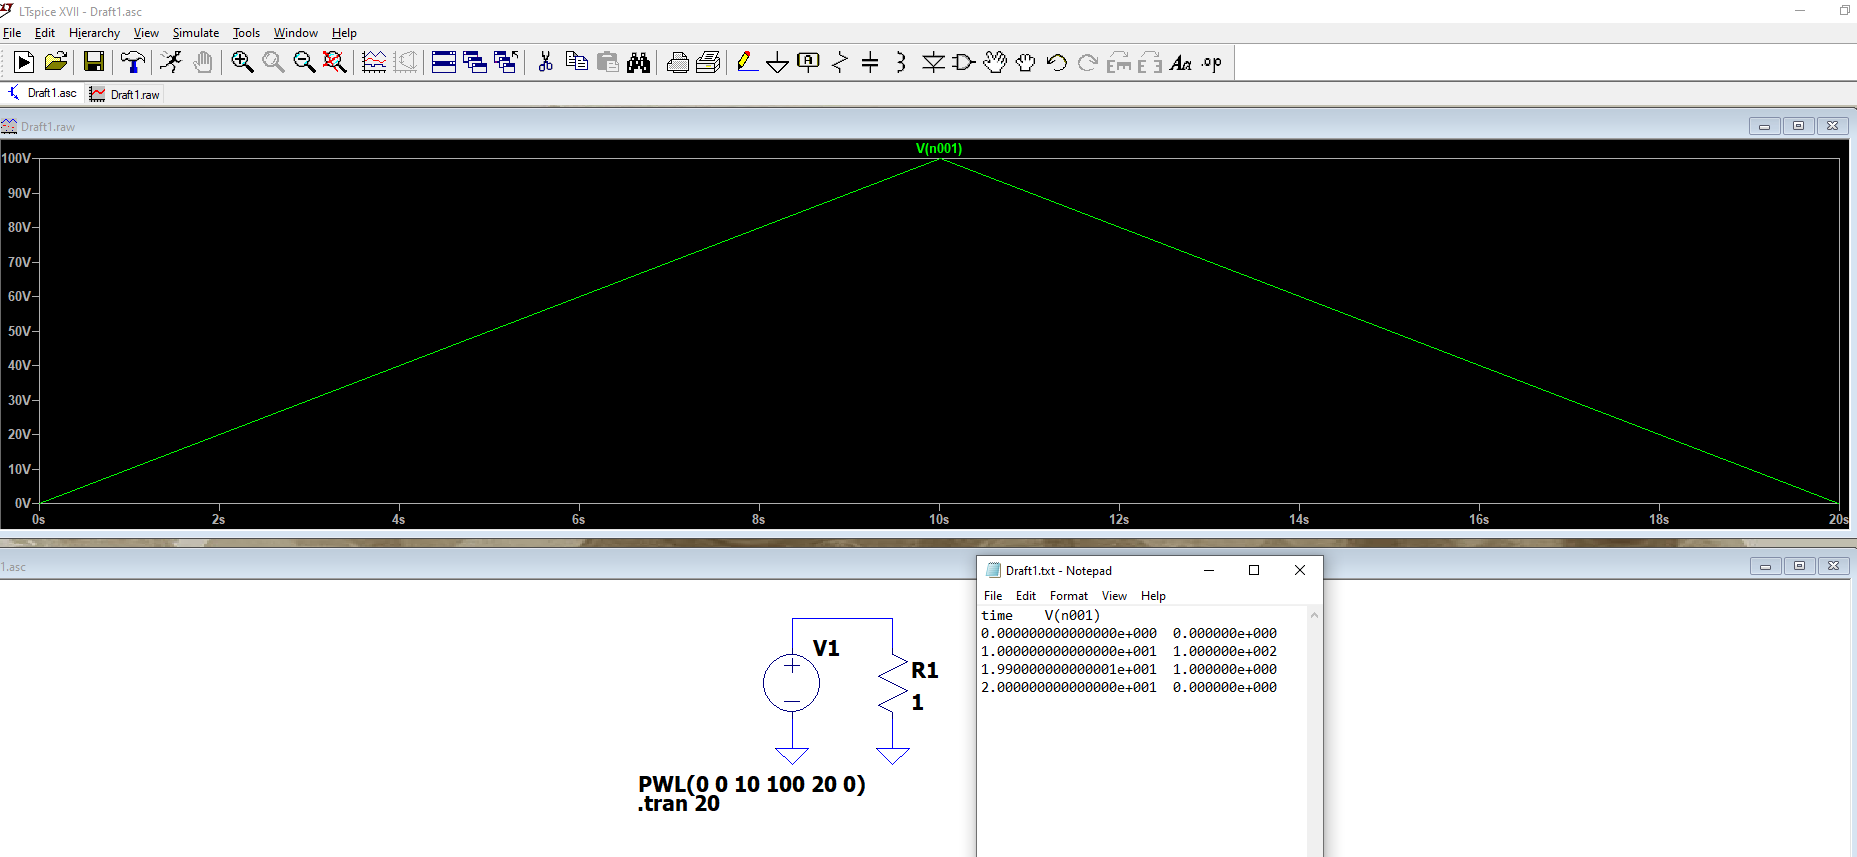
I would like to save the plot(x,y) point in LTSPICE in a txt file, but once try to export the graph to a txt file, the points are reduced.

So can you guide me (show me the command) to save all the plot point(with 1 second increment) without losing data.

here is a screenshot for the graph showing 10 points on the x axis but the txt file showing only 4 points

enter image description here

\$\endgroup\$
1
  • \$\begingroup\$ The points aren't reduced. The simulator only calculated those 4 points and linearly interpolated them to make the plot. One way to force more points is to include more points in your PWL, since that will force the simulator to do a solution there. \$\endgroup\$
    – Ste Kulov
    Commented Mar 6 at 14:07

1 Answer 1

2
\$\begingroup\$

The numbers on the bottom axis have nothing to do with how many points were plotted.

Try adding a Maximum Timestep to your simulation command, for example make your sim command .tran 0 20 0 1m, that should give you more points (I got 23). The smaller the timestep, the more points, but also the slower the simulation will run. If you leave it blank LTspice comes up with it's own value and it will probably go for the least amount of points it needs, for your simple PWL voltage it apparently only needed 4. Note that this is a maximum value, not an explicit number of points to plot. LTspice is known for trying to optimize simulation runs, so it will use some number of points up to the value you enter but it's got a mind of it's own so you never know exactly what it's going to do.

\$\endgroup\$
4
  • \$\begingroup\$ Thank you for your comment. Is there any way to get the value of "Y"(voltage) every 1 second and save them in txt or even get them from the log file? \$\endgroup\$
    – KamelK
    Commented Mar 4 at 20:07
  • \$\begingroup\$ @KamelK You could use .measure statements such as .meas tran vout_time1 find V(out) at 1 I;m not sure you can get more than one result per command but you can make multiple command. Each result needs a unique name so the next one would be .meas tran vout_time2 find V(out) at 2, then .meas meas tran vout_time3 find V(out) at 3, etc.. Results will be in the log file \$\endgroup\$
    – GodJihyo
    Commented Mar 4 at 20:33
  • 1
    \$\begingroup\$ there is a tool that can be found in the ltspice yahoo group that allows resampling. Also, try to turn off the compression \$\endgroup\$
    – Junius
    Commented Mar 4 at 20:33
  • \$\begingroup\$ Other ways I can think of to increase the number of data points: (1) Add more points to the PWL definition. (2) Take the FFT, and then take the FFT again of that result to get the impulse response with a new amount of points. \$\endgroup\$
    – Ste Kulov
    Commented Mar 6 at 14:22

Your Answer

By clicking “Post Your Answer”, you agree to our terms of service and acknowledge you have read our privacy policy.

Not the answer you're looking for? Browse other questions tagged or ask your own question.