0
\$\begingroup\$

I am having trouble reading data from a pressure sensor using MATLAB. The pressure sensor is connected to an NI 9219 Analog Input Device. Firstly, i tested the device to make sure it is working using NI DAQmx (Measurement and Automation Explorer) software and below is a waveform of an output received : Pressure Sensor Response in DAQmx software So i have tried a couple of things based on comments below, i have done 2 runs of the code changing only the addAnalogInputChannel settings:

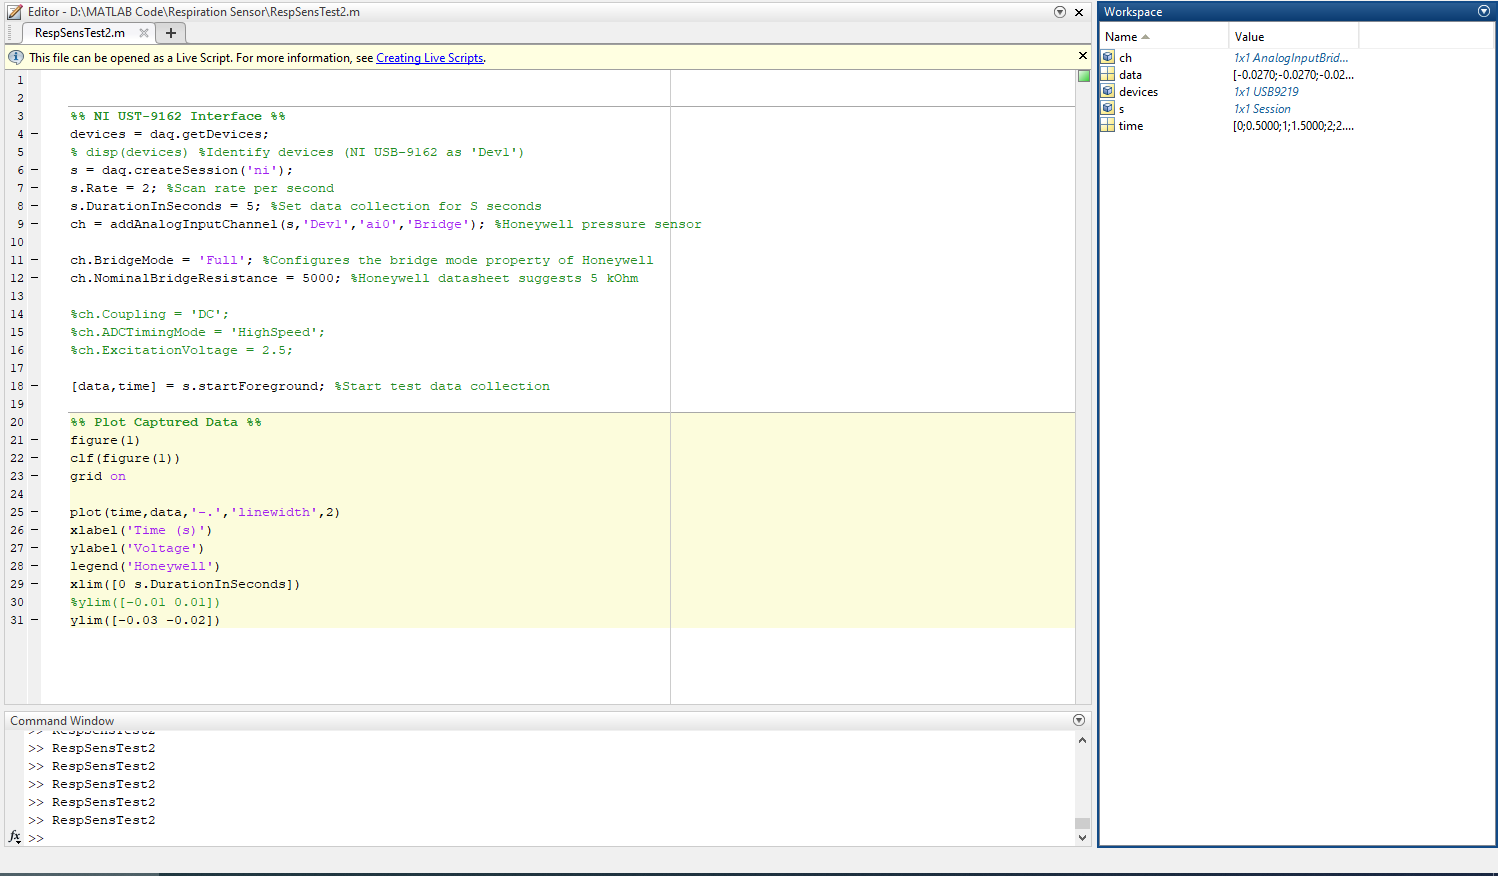
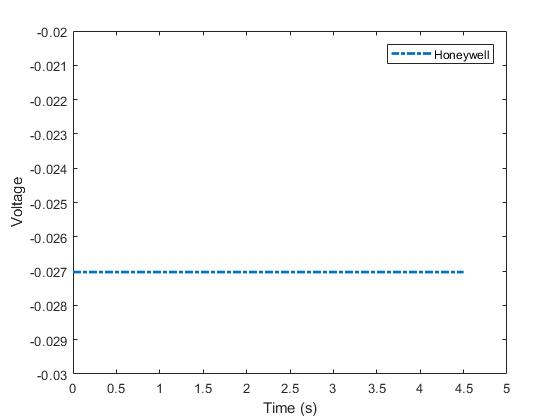
1) First Run is using Voltage in the addAnalogInputChannel, i have attached a picture of my workspace and Waveform below: Workspace for Voltage Voltage Waveform
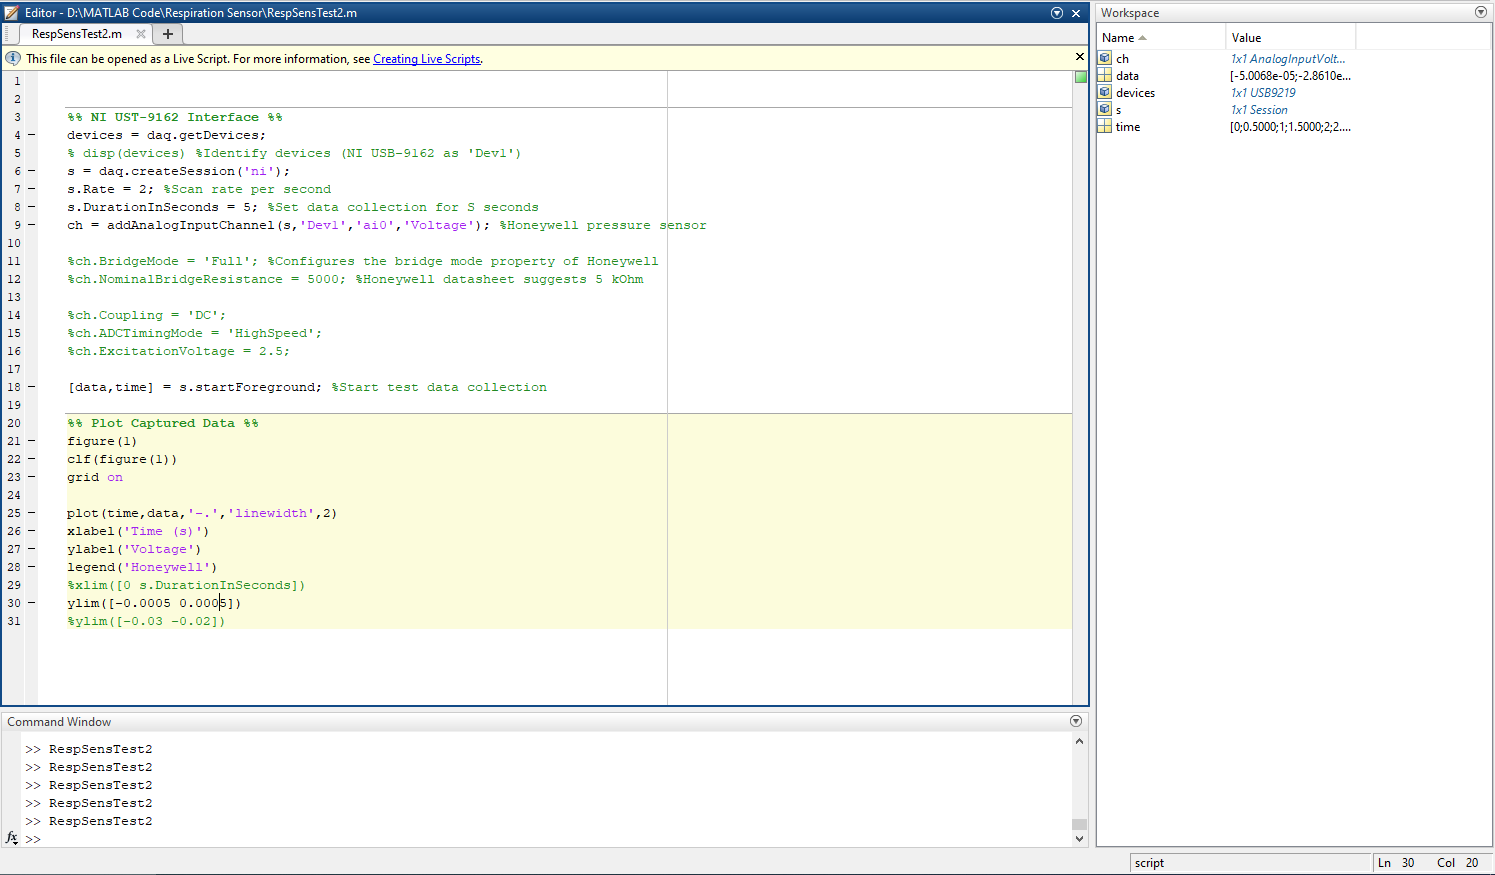
2) Second Run is using Bridge in the addAnalogInputChannel, i have attached a picture of my workspace and Waveform below:
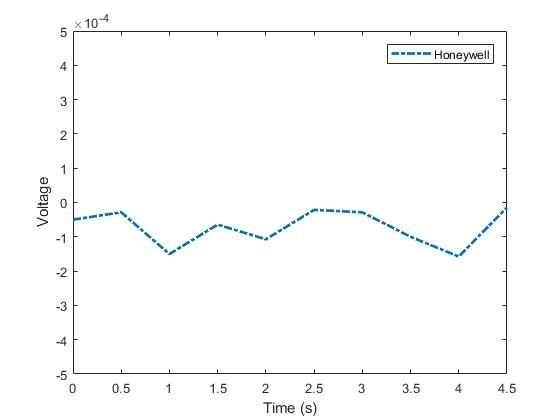
Bridge Code Bridge Waveform

My previous code is shown below:

%% NI UST-9162 Interface %%
devices = daq.getDevices;
% disp(devices) %Identify devices (NI USB-9162 as 'Dev1')
s = daq.createSession('ni');
ch0 = addAnalogInputChannel(s,'Dev1','ai0','Current'); %Honeywell pressure sensor

%ch0.BridgeMode = 'Full'; %Configures the bridge mode property of Honeywell
%ch0.NominalBridgeResistance = 5000; %Honeywell datasheet suggests 5 kOhm

ch.Coupling = 'DC';
ch.ADCTimingMode = 'HighSpeed';
ch.ExcitationVoltage = 2.5;
s.Rate = 2; %Scan rate per second
s.DurationInSeconds = 2; %Set data collection for S seconds
[data,time] = s.startForeground; %Start test data collection

%% Plot Captured Data %%
figure(1)
clf(figure(1))
grid on

plot(time,data,'-.','linewidth',2)
xlabel('Time (s)')
ylabel('Voltage')
legend('Honeywell')
xlim([0 s.DurationInSeconds])
ylim([-0.03 0.03])

I have listed the equipment below with links to datasheet:

1) Pressure Sensor(Mine is Port Type B with 6G)

2) NI-9219 Analog Input Module

3) MATLAB 2017b with Data Acquisition Tool Box

4) NI DAQmx

\$\endgroup\$
2
  • 1
    \$\begingroup\$ Hook up a known voltage to the DAQ, then poll it from matlab, if your not getting anything then look at the software until you do. \$\endgroup\$
    – Voltage Spike
    Commented Oct 2, 2019 at 21:13
  • \$\begingroup\$ If i understand stand your response correctly, the first waveform does show a response in DAQ but does not show response in MATLAB, the settings for both are exactly the same \$\endgroup\$
    – sk95
    Commented Oct 2, 2019 at 21:33

2 Answers 2

1
\$\begingroup\$

I had to call the tech support at mathworks and it turns out that at this point in time the library does not support NI-USB-9162 interface with the NI-9219 which is causing errors in reading data and setting parameters which is a development issue and the team is currently working on a solution and they will contact me if the problem is fixed.

\$\endgroup\$
0
\$\begingroup\$

It looks to me like your Y-axis on "the waveform" is kind of ambiguous (what are the units of "Amplitude")? If I look at the numbers on that axis closely, it goes from 0 to 1.65 milli-something.

Your MATLAB plot has a Y-axis of labeled "Voltage" and the scale goes from -30 milli-Volts to +30 milli-Volts. The "flat" line may just be an artifact of being "too zoomed out" on the Y-axis to see variation. Can't you print out the data vector in MATLAB (sorry, it's been a while) rather than insisting on the Plot to convey information to you, just for the purposes of debug?

\$\endgroup\$
1
  • \$\begingroup\$ i have edited my post with workspace and added more waveforms that are zoomed in , i believe my problem lies in not being able to use the following commands in my code as MATLAB gives me error when i try to set them : ch.Coupling = 'DC'; ch.ADCTimingMode = 'HighSpeed'; ch.ExcitationVoltage = 2.5; \$\endgroup\$
    – sk95
    Commented Oct 3, 2019 at 19:06

Your Answer

By clicking “Post Your Answer”, you agree to our terms of service and acknowledge you have read our privacy policy.

Not the answer you're looking for? Browse other questions tagged or ask your own question.