4
\$\begingroup\$

I want to measure the reflection coefficient.

I have the following circuit:

enter image description here

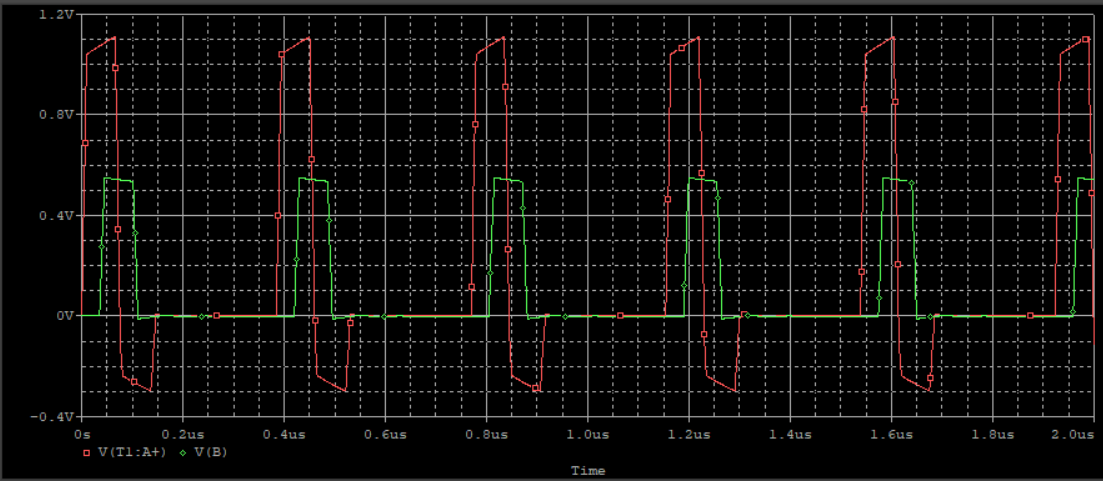
With these measurements I get the following graphs:

enter image description here

Is the reflection coefficient the negative peak of the RED signal divided by the positive peak of the RED signal, or is it the positive peak of GREEN divided by positive peak of RED?

By the way, I'm measuring that way because I have an upcoming lab in which I have to measure this way.

\$\endgroup\$
0

2 Answers 2

7
\$\begingroup\$

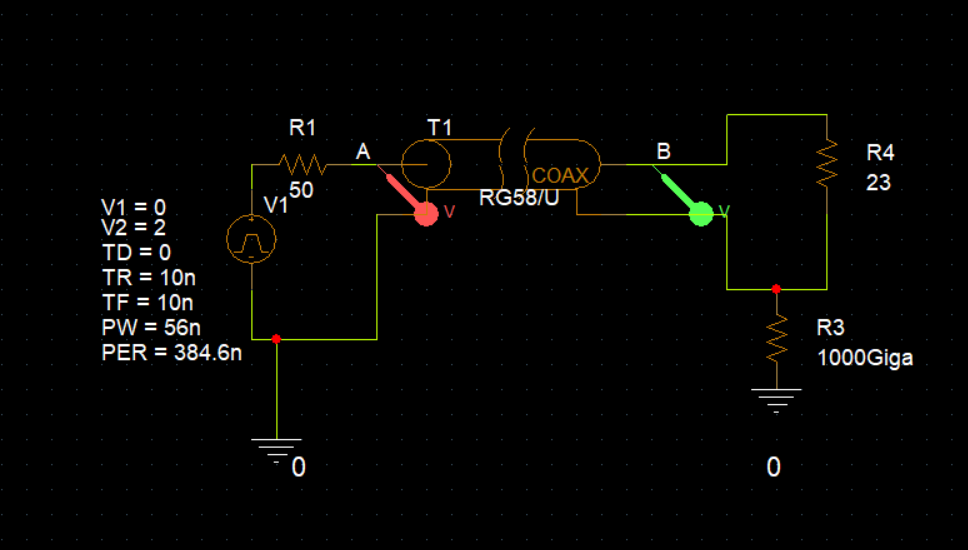
It's probably better to demonstrate this if I set up a microcap simulation circuit: -

enter image description here

I've modelled a lossless transmission line of impedance 50 Ω and length 25 metres. I've chosen this length so that the forward and return pulses do not overlap in time. I've energized the circuit with a 2 volt 50 ns pulse.

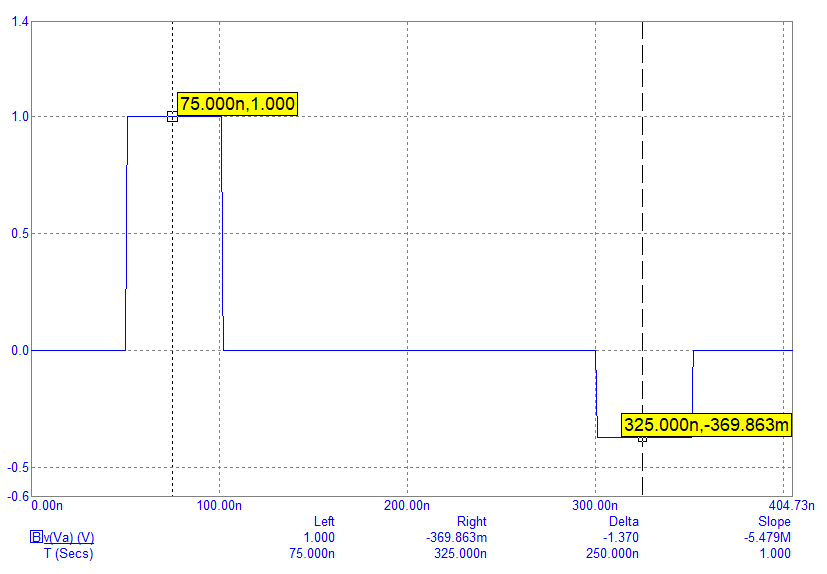
If I look at the voltage at node \$V_a\$ I see this: -
enter image description here

So, the initial pulse height at node \$V_a\$ is 1 volt due to the applied pulse of 2 volts being potentially divided by the 50 Ω resistor (R1) and the characteristic impedance of the cable (also 50 Ω).

The reflected voltage pulse has an amplitude of -0.369863 volts and, it is this amplitude relative to the 1 volt originally seen at node \$V_a\$ that represents the reflection coefficient because: -

$$\Gamma = \dfrac{R_2-Z_0}{R_2+Z_0} = \dfrac{23-50}{23+50} = -0.369863$$

Is the reflection coefficient the negative peak of the RED signal divided by the positive peak of the RED signal

Yes it is but, do yourself a big favour and double-check the model of the RG58 cable you have used. The slopes at the peaks of your pulses are off-putting and, will lead to inaccuracy in how you interpret \$\Gamma\$. Of course, it could be that you need a much better time-resolution for your simulation. For instance, the maximum timestep I used in my microcap simulation was 10 ps; I suspect that if you do the same, your waveform images will be less ambiguous.

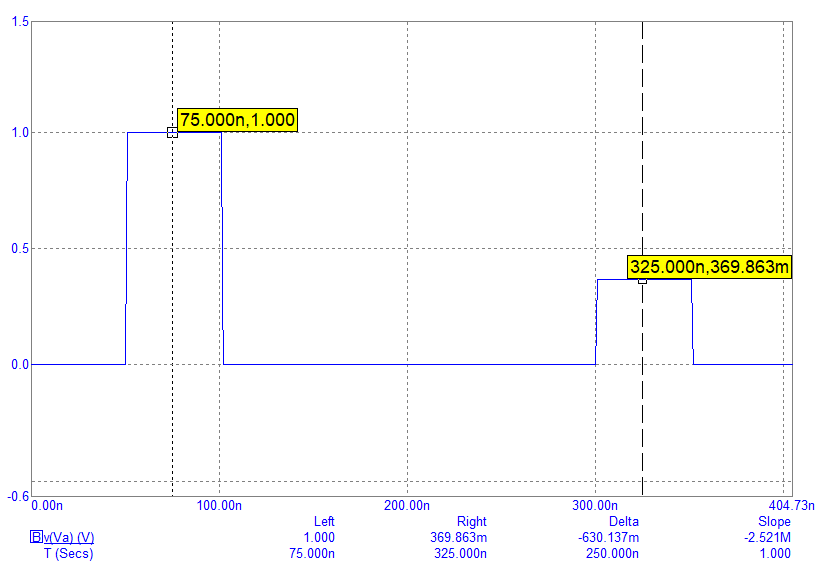
Also be aware that if the terminating impedance is higher than 50 Ω there won't be a negative reflection. For instance, we can get the same magnitude of reflection coefficient (0.369863) with a termination resistance of 108.69565 Ω but the returning pulse is positive: -
enter image description here

Another thing to remember is that the ratio of the peaks is only truly representative of \$\Gamma\$ when the source impedance (R1) matches the line impedance.


Lossless line used has L = 250 nH per metre and C = 100 pF per metre and this results in a characteristic impedance of \$\sqrt{\frac{L}{C}}=\sqrt{2500}\$ = 50 Ω.

\$\endgroup\$
5
  • \$\begingroup\$ isn't the gamma you have calculated (analytically) is at point B, while the red signal signifies point A? I mean, the gamma calculation for A will be done using Zl= 23+50=73 , where 50 is from the coax ? \$\endgroup\$ Commented Jun 27 at 8:12
  • \$\begingroup\$ @CuriousCosmopolitan I have no idea what you mean. Where is my red signal? \$\endgroup\$
    – Andy aka
    Commented Jun 27 at 8:17
  • \$\begingroup\$ I was referencing to the original question. In that, the red signal is at point A while the green signal is at point B. \$\endgroup\$ Commented Jun 27 at 8:27
  • \$\begingroup\$ What I mean is, since gamma is ( Zl-Z0/(Zl+Z0), at point A, Zl=73 while at point B, Zl=23. And since we are referencing point A, Zl=73 should be used ? \$\endgroup\$ Commented Jun 27 at 8:31
  • \$\begingroup\$ No, sorry I disagree. Maybe you should raise a new post to get an answer to the confusion? \$\endgroup\$
    – Andy aka
    Commented Jun 27 at 8:40
1
\$\begingroup\$

What is measured, at the beginning, at the input (point A) is the "emission" coefficient Ke, and if the generator Impedance is 50 Ohm, then it would be
\$Ke=Zo/(Zo+50)=0.5\$.

Note that there is also a reflected voltage on generator which is this case Kg=0 (calculated as Kr).

At point B, there is a reflection coefficient whose value is \$Kr=(Zr-Zo)/(Zr+Zo)=(-27)/73=~ -0.37\$.

In general (many reflections), you must add the reflected voltages versus time to know the instantaneous voltages you see on the scope.

Here, it is a short transient because the generator is well adapted.

enter image description here

See this if the line "length" is a little shorter (3 m in place of 5 m).

enter image description here

And here a more realistic simulation for comparison (added R).

enter image description here

\$\endgroup\$
1
  • \$\begingroup\$ Thanks for moving that \$\endgroup\$
    – Voltage Spike
    Commented May 20, 2022 at 18:13

Your Answer

By clicking “Post Your Answer”, you agree to our terms of service and acknowledge you have read our privacy policy.

Not the answer you're looking for? Browse other questions tagged or ask your own question.