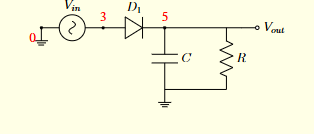
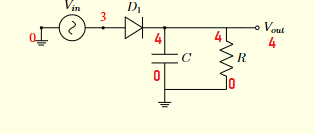
4
\$\begingroup\$

I am 17 years old. I'm still in 12th grade. However, I love discovering new things and learning so I can be a more informed person. So, it was suggested to me that I try to script an envelope detector in NGSpice and I have already created an AM signal. Even so, I can't do the upper envelope. I thought it was because of the capacitor's discharge time, but I actually don't know what else I can do.

This is my script:

* -------------------- PARÂMETROS --------------------
.param A_c=1         ; Amplitude da portadora
.param f_c=50k       ; Frequência da portadora (Hz)
.param A_m=1         ; Amplitude do modulador
.param f_m=5k        ; Frequência do modulador (Hz)
.param mu=0.5        ; Índice de modulação
.param R=100k        ; Resistência de carga (ohms) ajustado
.param C=3u         ; Condensador maior para evitar que descarregue rapidamente
.param tau={R*C}     ; Constante de tempo

* -------------------- FONTES DE SINAIS --------------------
Vcarrier n1 0 SIN(0 {A_c} {f_c})
    ; Fonte sinusoidal para a portadora
Vmod n2 0 SIN(0 {A_m} {f_m})
    ; Fonte sinusoidal para o modulador

* -------------------- MISTURA DE SINAIS (MODULAÇÃO AM) --------------------
Bmodulated n3 0 V={A_c} * (1 + {mu} * V(n2)) * sin(2 * 3.14159 * {f_c} * time)
    ; Geração do sinal AM modulado

* -------------------- CIRCUITO DE DETECÇÃO DE ENVELOPE -------------------
.model DBAT46 D(Is=2.2e-8 Rs=0.1 Cjo=2e-12 M=0.33 N=1.05 Vj=0.7 Eg=0.69)  ; Modelo do diodo
D1 n3 n4 DBAT46                   ; Diodo BAT46 para retificação
C1 n4 0 {C}                        ; Condensador ligado ao terra (0) 
R1 n5 0 {R}                         ; Resistência para descarregamento 


* -------------------- ANÁLISE DE TRANSIENTE --------------------
.control
run
tran 0.01u 2m uic
    ; Simulação transiente de 2ms com passos de 0.01us

* Plotar sinais
plot V(n3) V(n5)
    ; Comparar o sinal modulado com o envelope detectado

* Exportar gráfico no Gnuplot
set gnuplot_terminal=png
gnuplot envelope_detected.png V(n3) V(n5)
    xlabel 'tempo (s)'
    ylabel 'tensão (V)'

* Exibir valores de tensão detectada
print V(n5)

quit
.endc

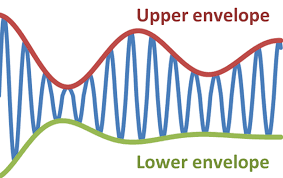
My problem is that I can´t create the upper envelope, represented in this picture by the red line: Upper envelope
This is my schematic belonging to this simulation and the plot of the output plot of the outputMy circuit
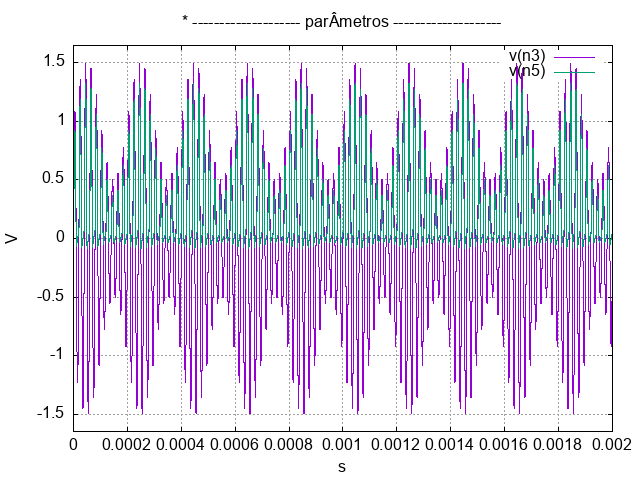
New contributor
user480593 is a new contributor to this site. Take care in asking for clarification, commenting, and answering. Check out our Code of Conduct.
\$\endgroup\$
13
  • \$\begingroup\$ Hi! And welcome here! It's fantastic you're working at this level! \$\endgroup\$ Commented 10 hours ago
  • \$\begingroup\$ could you do us the favor and add the schematic belonging to this simulation to your question, as well as the plot of the output? (I ask because I had to take out a pen and a piece of paper and draw the circuit from the connections as specified in your SPICE script. For the others: this is a series of a diode, a capacitor and a resistor. "unconnected" side of diode is fed with ground-referenced AM signal, "unconnected" end of resistor connected to ground. Observed output voltage is that over the resistor.) \$\endgroup\$ Commented 10 hours ago
  • \$\begingroup\$ Ok, I'll add the schematics as an answer... I'm sure it's not the right solution, but I'm not yet an expert on this platform, sorry \$\endgroup\$
    – user480593
    Commented 9 hours ago
  • \$\begingroup\$ Actually, I could add it by editing my question :) \$\endgroup\$
    – user480593
    Commented 9 hours ago
  • \$\begingroup\$ exactly, add it by editing your question! :) That's the right way! \$\endgroup\$ Commented 9 hours ago

3 Answers 3

3
\$\begingroup\$

To maintain the integrity of the message signal when detecting the envelope, this inequality must be satisfied

$$B < \frac{1}{2\pi RC} \ll f_c \tag1$$

\$B\$ is the bandwidth of your message signal (in this case 5 kHz), and \$f_c\$ is the frequency of your carrier.

You have chosen \$R=100 \: \text{k}\Omega\$ and \$C = 10 \: \mu\text{F}\$, which yields a time constant of \$\tau = \frac{1}{RC} = 1 \: \text{s} \$. This value does not satisify the inequality in (1). You should try to decrease the value of your capacitor significantly. Also, you could also try increasing your carrier frequency to a much higher value.

\$\endgroup\$
1
  • \$\begingroup\$ Thank you very much, I will follow your tips, very useful \$\endgroup\$
    – user480593
    Commented 9 hours ago
0
\$\begingroup\$

A few problems, one of which @Carl has addressed.
Marcus has pointed out the other problem with SPICE netlist nodes:SPICE netlist node numbers on schematic


The SPICE netlist for this schematic would correspond to the schematic above. \$V_{in}\$ at node #3 is not included here:

D1 n3 n4 DBAT46                   ; Diodo BAT46 para retificação
C1 n4 0 {C}                       ; Condensador ligado ao terra (0) 
R1 n4 0 {R}                       ; Resistência para descarregamento 

Demodulator output \$V_{out}\$ is now node #4, not node #5, and node #4 voltage is the one you would plot as output.

Since modulation of 5kHz is close to carrier frequency of 50 kHz, choice of the RC time constant in the demodulator filter is fairly tightly constrained.
If R=100k, capacitance C would better be in the nanofarad region.

\$\endgroup\$
0
\$\begingroup\$
* Fonte AM
V1 0 1 AM(0 0 12 0.05k 1k 0 0 0)

* Componentes
D1 1 2 DBAT15
C1 2 0 0.1u
R1 2 0 10k

* Modelos do díodos
.model DBAT15 D(Is=1e-14 Rs=0.1 Cjo=1e-12 M=0.33 
     + N=1.05 Vj=0.3 Eg=1.11)

* Análise transiente
.tran 0.01ms 20ms

.control
    run
    set xbrushwidth=2
    set gnuplot_terminal=png pngcairo transparent/quit
    gnuplot marta02 v(1)  v(2)
*     plot v(1) v(2)
    quit
.endc
New contributor
Luis Ferreira is a new contributor to this site. Take care in asking for clarification, commenting, and answering. Check out our Code of Conduct.
\$\endgroup\$
1
  • \$\begingroup\$ I edited the answer to format the script as code to make it readable. However, there is no explanation of how the script answers the question. Consider editing the answer to include a description of how it answers the question. \$\endgroup\$ Commented 5 hours ago

Your Answer

By clicking “Post Your Answer”, you agree to our terms of service and acknowledge you have read our privacy policy.

Not the answer you're looking for? Browse other questions tagged or ask your own question.