65
\$\begingroup\$

Noise figures in (op-amp) datasheets are expressed in V/√Hz, but

  1. Where does this unit come from? Why the square root? How should I pronounce it?
  2. How should I interpret it?
  3. I know lower is better, but will a noise figure that doubles also double the trace width on my scope?
  4. Is this value useful in calculating signal to noise ratio? Or what fun calculations can I do with this number?
  5. Is noise always expressed in V/√Hz?
\$\endgroup\$
1

3 Answers 3

48
\$\begingroup\$

"Volt per square root hertz".

Noise has a power spectrum, and as you might expect the wider the spectrum the more noise you'll see. That's why the bandwidth is part of the equation. The easiest is to illustrate with the equation for thermal noise in a resistor:

\$ \dfrac{v^2}{R} = 4kT\Delta f \$

where \$k\$ is Boltzmann's constant in joules per kelvin, and T is temperature in kelvin. \$\Delta f\$ is the bandwidth in Hz, just the difference between maximum and minimum frequency.
The left hand side is the expression for power: voltage squared over resistance. If you want to know the voltage you rearrange:

\$ v = \sqrt{4kT R\Delta f} \$

That's why you have the square root of the bandwidth. If you would express the noise in terms of power or energy you wouldn't have the square root.

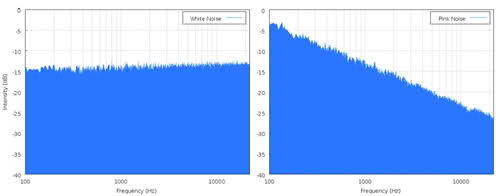
All noise is frequency related, but energy spectra may differ. White noise has an equal power across all frequencies. For pink noise, on the other hand, noise energy decreases with frequency. Flicker noise is therefore also called \$1/f\$ noise. In that case bandwidth in itself is meaningless.

The left graph shows the flat spectrum of white noise, the right graph shows pink noise decaying 3dB/octave:
enter image description here

You can make noise visible on an oscilloscope, but you can't measure it that way. That's because what you can see is the peak value, what you need is the RMS value. The best thing you're getting out of it is that you can compare two noise levels, and estimate one is higher than the other. To quantify noise you have to measure its power/energy.

\$\endgroup\$
5
  • 3
    \$\begingroup\$ It is "volts per square root hertz", "joules", "kelvin" (all in lowercase, except if they start a sentence) and "3 dB/octave" (with a space between the numeric value and unit symbol). See Tables 1 and 3 in physics.nist.gov/cuu/Units/units.html , and #5 ("meters per second" in example) and #15 in physics.nist.gov/cuu/Units/checklist.html \$\endgroup\$
    – Telaclavo
    Commented May 20, 2012 at 12:07
  • 1
    \$\begingroup\$ @Telaclavo - I know! :-) But I sometimes make the mistake because I also know (some people make errors against that) that the abbreviation for a unit derived from a person's name is indeed with a capital letter. Hence the confusion. I'll fix it. \$\endgroup\$
    – stevenvh
    Commented May 20, 2012 at 17:26
  • \$\begingroup\$ 'flicker noise' = 'pink noise'? You base your explanation on thermal noise in a resistor, can I compare R and T with input impedance of the opamp and the chip's temperature? (my feeling says 'no', but I don't know why). \$\endgroup\$
    – jippie
    Commented Jun 17, 2012 at 18:04
  • \$\begingroup\$ @jippie - Yes, flicker noise is pink. The T is obviously the chip's temperature, but R isn't about the input impedance, which in fact may be very high, like 10\$^{12}\$ \$\Omega\$. It's about resistances in the device, where the free movement of charge carriers cause the noise. That's required, otherwise an infinite resistance would cause an infinite noise and that doesn't happen. Otherwise that 10\$^{12}\$ \$\Omega\$ input impedance would cause no less than 18 mV RMS noise over the audio bandwidth. \$\endgroup\$
    – stevenvh
    Commented Jun 18, 2012 at 5:18
  • \$\begingroup\$ note that if your spectrum measures W/octave instead of W/Hz, those two graphs will be tilted counterclockwise, and pink noise plot will be flat. \$\endgroup\$
    – endolith
    Commented Apr 24, 2014 at 18:48
18
\$\begingroup\$

Is this value useful in calculating signal to noise ratio? Or what fun calculations can I do with this number?

To convert the spectral density \$\tilde v\$ (in nV/√Hz) to a voltage (in VRMS), you need to multiply it by the square root of the bandwidth: $$ v_\mathrm{RMS}=\tilde v \cdot \sqrt{\Delta f} $$ For example, if the op-amp is a TLC071, with equivalent input noise voltage density of 7 nV/√Hz, and audio bandwidth, the total equivalent input noise is:

Assuming this is the dominant noise source, if the noise gain of your amp is 10× (= +20 dB) the output noise is then:

  • 0.99 μVrms ⋅ 10 = 9.9 μVrms

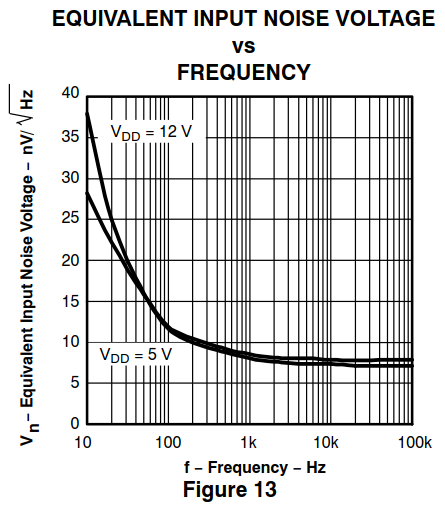
Note that the actual noise curve is not always 7 nV/√Hz, it slopes up at low frequencies:

TLC071 equivalent input noise voltage vs frequency

Turns out that's ok because the X axis is logarithmic and the units of noise are not, so it has very little effect on the total (the non-flat part below 1 kHz is only 5% of our total bandwidth, measured linearly). If you need a more accurate value you can (numerically) integrate and get the area under the (squared) curve: $$ v_\mathrm{RMS}=\sqrt{\int^{f_2}_{f_1} \! \tilde v(f)^2\,df} $$ Or simulate it in SPICE (I get 0.82 μVrms EIN).

Also, real circuits do not have ideal brickwall HPF and LPF filters, so you can compensate for this using "brickwall correction factors" to calculate the "equivalent noise bandwidth".

If your circuit has 1-pole filters, for instance, the total noise would then be

  • 7 nV/√Hz ⋅ √(1.57 ⋅ (20000 Hz - 20 Hz)) = 1.24 μVrms

(Sanity check: SPICE with noiseless filters measures at 1.22 μVrms.)

\$\endgroup\$
3
  • \$\begingroup\$ Does (nV/√Hz) ⋅ √(bandwidth) = μVrms, or did you scale your answer to uVrms when the math would be in nVrms? See this related question: electronics.stackexchange.com/q/565805/256265 \$\endgroup\$
    – KJ7LNW
    Commented May 19, 2021 at 1:52
  • 1
    \$\begingroup\$ nV/√Hz * √Hz = nV, like any other dimensional analysis. I just converted 1240 nVrms to 1.24 μVrms wolframalpha.com/input/… \$\endgroup\$
    – endolith
    Commented May 19, 2021 at 2:53
  • 1
    \$\begingroup\$ thank you for confirming. I wondered if something about your math actually changed the unit (though I admit, I didn't do your math to realize the result was 1240 which would have been my hint!) \$\endgroup\$
    – KJ7LNW
    Commented May 20, 2021 at 0:14
5
\$\begingroup\$

When talking noise figures, we're not always talking about voltages. Often, we look at power instead. A power spectral density plot shows us how this power is distributed among frequencies. Integrated over the entire range of frequencies is of course the total power produced, expressed in watts, so the integrand is commonly expressed in units watts per hertz.

While the total power can be a useful measure for the amount of noise, the same is not true for voltages. Such a plot would be zero everywhere because it produces no net voltage, only variations. This variance is expressed as the signal squared, i.e. in units V², corresponding neatly to the power spectral density discussed earlier: power is proportional to the voltage squared.

If you would see how the voltage variance is distributed among frequencies, you would use the units volt squared per hertz. You can convert the variance back to signal strength by taking the square root: V/√Hz. Both are used and both mean the same thing.

\$\endgroup\$

Your Answer

By clicking “Post Your Answer”, you agree to our terms of service and acknowledge you have read our privacy policy.

Not the answer you're looking for? Browse other questions tagged or ask your own question.