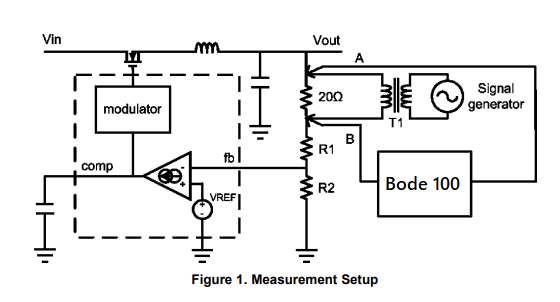
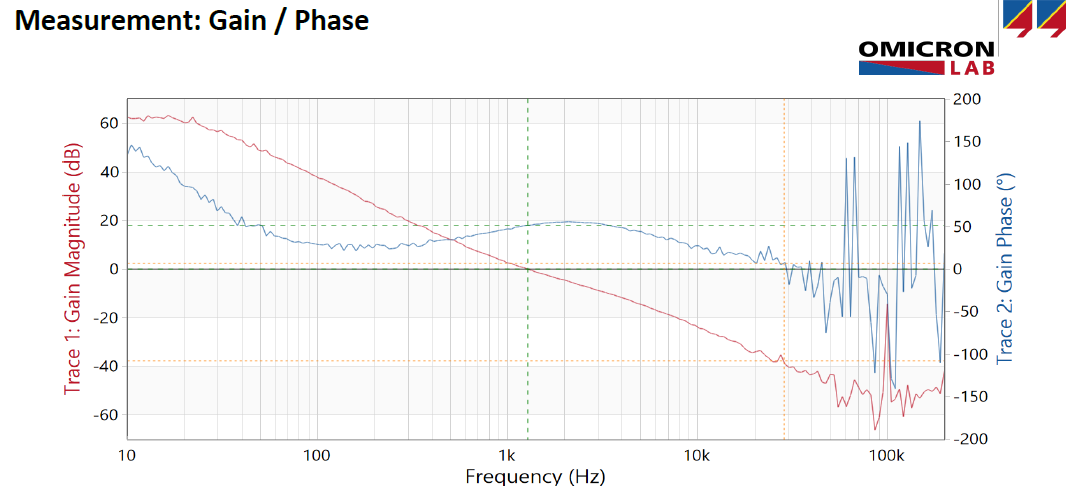
I am trying to decode the bode plot of a feedback loop of power supply measured onon Bode 100 (network analyser) in 'intuitive manner'.
1.High Gain High gain ( 60 dB60 to 40dB40 dB) at lower frequencies ( 0Hz0 -100Hz100 Hz) indicates that very small feedback voltage is needed to keep the power supply output regulated.
2.High High phase margin at lower frequency indicates that , feedback voltage's most of the part will be subtracted from Vref ( negative feedback).
3.As As frequency increases , it takes higher feedback voltage to keep the power supply output regulated and at 0dB0 dB it requires as much as feedback voltage of output voltage value at the feedback pin for regulation ( 0db0 dB = 1Gain1 gain = Vout / Vfeedback)
4.For For frequencies beyond crossover , feedback voltage no longer regulate power supply in single cycle but will take a number of cycle to regulates since gain is in fractional number.
5.As As frequency increases , the feedback signal phase is more going towards 180 degree leading to addition of feedback signal instead substractionsubtraction from Vref at the error amplifier (positive feedback) .
Are above listed understandings correct about Bode plot ? ifIf not, kindly eloborate elaborate.
Thanks in advance.


