0
\$\begingroup\$

I am trying to plot the power spectrum (\$|FT(f)|^2\$) of a Gaussian function, and overlap it with the theoretically expected spectrum calculated from the Fourier transform pair:

\$e^{-\alpha t^2} \iff \sqrt{\frac{\pi}{\alpha}} e^{-\pi^2 \nu^2 / \alpha}.\$

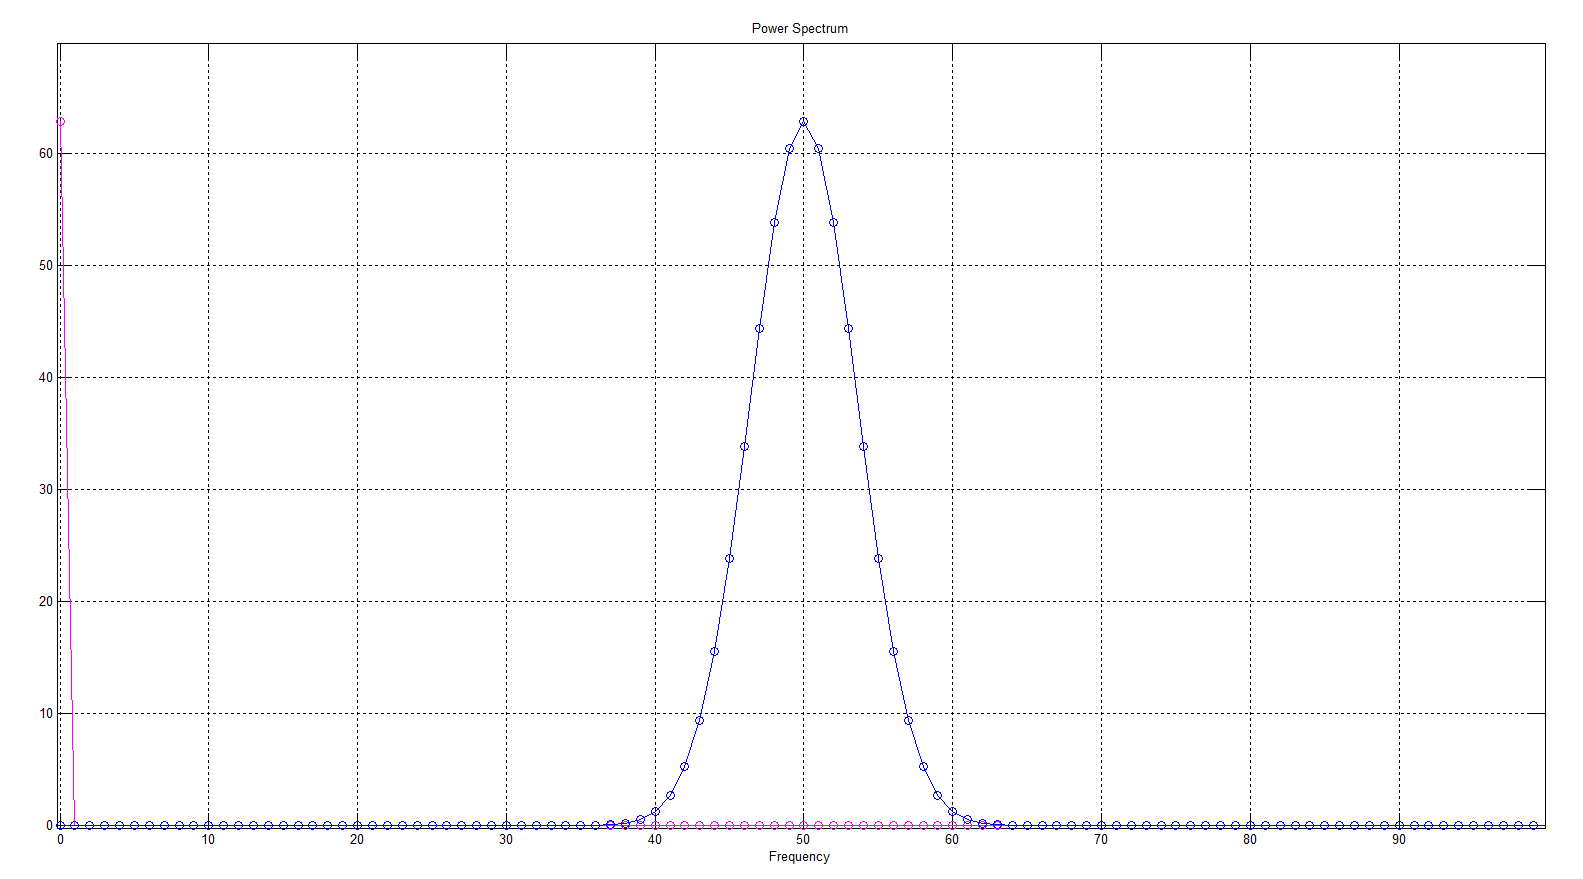
But when I do this in Matlab they look completely different:

enter image description here

So, what is wrong here? I am very confused but I think it has something to do with the differences in the normalization of FT used here with that of the DFT of Matlab. What exactly do I need to change in the code in order for the plots to match?

Any help would be greatly appreciated.

Here is my code:

clear; clf; clc;
a=0.05;
n=50; % length of DFT
k=[-n:1:n];

x=exp(-a.*k.^2); % Gaussian function

nu=[0:1:2*n];
xx=fft(x); % DFT calculation
y=(sqrt(pi/a)).*exp((-pi^2*nu.^2)./a); % Theoretical
yy=(abs(y)).^2; % Power spectrum


% subplot(2,1,1) % Power spectrum plot
plot(nu, yy, '-om'); hold on;
hold on; plot(nu,(abs(fftshift(xx))).^2,'-o'); grid;xlabel('Frequency');
title('Power Spectrum')
hold off;

% subplot(2,1,2) % Temporal waveform plot
% plot(k,x);grid;
% xlabel('Time');
% title('Data waveform');
% hold on; plot(k,x,'o'); hold off;

figure(gcf);
\$\endgroup\$
1
  • 1
    \$\begingroup\$ one of the plots is a '1' at the origin. This is obviously wrong, and is the place to look for your error. I notice you are still using k=[-n:1:n] without normalising to n. While setting a to 0.05 does get you a sensible plot, normalising to n and using an 'a' value like 5 will give you a sigma at the extrema of the plot equal to 'a', much easier to interpret later, leaving n unnormalising and frigging a to something meaningless is something of a kludge. \$\endgroup\$
    – Neil_UK
    Commented Apr 23, 2016 at 14:15

1 Answer 1

1
\$\begingroup\$

The problem is your calculation of the theoretical Fourier values.

When you do a DFT with N points, the interval between points on the frequency axis is \$ \Delta f = 1/(N t_s) \$ where \$ t_s\$ denotes the sampling time.

Therefore you have to calculate the theoretical Fourier values with $$ \sqrt{\frac{\pi}{a}}\exp{-(\frac{(\pi k)^2}{(Nt_s)^2\cdot a})} $$

Use nu=[-n:1:n]; and y=(sqrt(pi/a))*exp((-pi^2*nu.^2)/((2*n+1)^2*a)); in your code.

\$\endgroup\$
0

Your Answer

By clicking “Post Your Answer”, you agree to our terms of service and acknowledge you have read our privacy policy.

Not the answer you're looking for? Browse other questions tagged or ask your own question.