I'm attempting to debug a bare-metal application on iMX6UL with Segger JLink Pro. I seem to be able to connect and download the application properly:
$ JLinkExe -Device mcimx6g2
SEGGER J-Link Commander V6.30k (Compiled Apr  9 2018 18:33:16)
DLL version V6.30k, compiled Apr  9 2018 18:33:07

Connecting to J-Link via USB...O.K.
Firmware: J-Link V10 compiled Mar 29 2018 17:45:34
Hardware version: V10.10
S/N: 600101813
License(s): RDI, FlashBP, FlashDL, JFlash, GDB
VTref = 3.319V


Type "connect" to establish a target connection, '?' for help
J-Link>connect
Please specify target interface:
  J) JTAG (Default)
  S) SWD
TIF>
Device position in JTAG chain (IRPre,DRPre) <Default>: -1,-1 => Auto-detect
JTAGConf>
Specify target interface speed [kHz]. <Default>: 4000 kHz
Speed>1000
Device "MCIMX6G2" selected.


Connecting to target via JTAG
J-Link script: Setting up AP map
TotalIRLen = ?, IRPrint = 0x..000000000000000000000000
J-Link script: Setting up AP map
TotalIRLen = 13, IRPrint = 0x0101

**************************
WARNING: At least one of the connected devices is not JTAG compliant (IEEE Std 1149.1, 7.1.1.d, IR-cells). (NumDevices = 3, NumBitsSet = 2)

**************************

JTAG chain detection found 3 devices:
 #0 Id: 0x5BA00477, IRLen: 04, CoreSight JTAG-DP
 #1 Id: 0x00000001, IRLen: 05, Unknown device
 #2 Id: 0x1891D01D, IRLen: 04, JTAG-DP
AP map detection skipped. Manually configured AP map found.
AP[0]: AHB-AP (IDR: Not set)
AP[1]: APB-AP (IDR: Not set)
Using preconfigured AP[1] as APB-AP
AP[1]: APB-AP found
ROMTbl[0][0]: CompAddr: 80001000 CID: B105900D, PID:04-001BB961 TMC
ROMTbl[0][1]: CompAddr: 80002000 CID: B105900D, PID:04-004BB906 CTI
ROMTbl[0][2]: CompAddr: 80003000 CID: B105900D, PID:04-004BB912 TPIU
ROMTbl[0][3]: CompAddr: 80004000 CID: B105F00D, PID:04-001BB101 TSG
ROMTbl[0][4]: CompAddr: 80020000 CID: B105100D, PID:04-000BB4A7 ROM Table
ROMTbl[1][0]: CompAddr: 80030000 CID: B105900D, PID:04-005BBC07 Cortex-A7
Found Cortex-A7 r0p5
6 code breakpoints, 4 data breakpoints
Debug architecture ARMv7.1
Data endian: little
Main ID register: 0x410FC075
I-Cache L1: 32 KB, 512 Sets, 32 Bytes/Line, 2-Way
D-Cache L1: 32 KB, 128 Sets, 64 Bytes/Line, 4-Way
Unified-Cache L2: 128 KB, 256 Sets, 64 Bytes/Line, 8-Way
System control register:
  Instruction endian: little
  Level-1 instruction cache enabled
  Level-1 data cache disabled
  MMU disabled
  Branch prediction enabled
Cortex-A7 identified.
J-Link>halt
PC: (R15) = 00008588, CPSR = 400001F3 (SVC mode, THUMB FIQ dis. IRQ dis.)
Current:
    R0 =00000000, R1 =00900A30, R2 =10000000, R3 =00000800
    R4 =00000000, R5 =00000002, R6 =00900BC4, R7 =02020000
    R8 =0000858C, R9 =0000858C, R10=021E8000, R11=0001C200, R12=000100A1
    R13=00000000, R14=020E0014, SPSR=0091FF64
USR: R8 =021E8000, R9 =0001C200, R10=000100A1, R11=00000000, R12=020E0014
    R13=74EBFF3F, R14=88CF1BAA
FIQ: R8 =D5414CD5, R9 =C2C0BE88, R10=BF81059E, R11=B1E909E0, R12=B59B17CF
    R13=E0D763BF, R14=4945FC6E, SPSR=3F0ADED2
IRQ: R13=D68B397E, R14=1DBD7DCF, SPSR=670467EF
SVC: R13=0091FF64, R14=00002F4B, SPSR=000001D3
ABT: R13=DA163F5A, R14=79EBF7E5, SPSR=C50E1756
UND: R13=F0F71639, R14=618DCCFE, SPSR=C907A3EA
J-Link>SetPC 907000
J-Link>loadbin "test.bin" 907000
Halting CPU for downloading file.
Downloading file [test.bin]...
O.K.
J-Link>verifybin "test.bin" 907000
Loading binary file test.bin
Reading 66348 bytes data from target memory @ 0x00907000.
Verify successful.
I performed some spot checks at memory offsets (0x00, 0x100, 0x200, etc) and it matches the binary file. However, when I attempt to run the application, the processor jumps outside the application memory and does not run properly:
J-Link>mem32 907000, 2
00907000 = E59FF018 E59FF018
J-Link>mem32 907100, 2
00907100 = EE40AF10 F57FF06F
J-Link>mem32 907200, 2
00907200 = E3800040 EE010F30
J-Link>halt
PC: (R15) = 00907000, CPSR = 400001F3 (SVC mode, THUMB FIQ dis. IRQ dis.)
Current:
     R0 =00000000, R1 =00900A30, R2 =10000000, R3 =00000800
     R4 =00000000, R5 =00000002, R6 =00900BC4, R7 =02020000
     R8 =0000858C, R9 =0000858C, R10=021E8000, R11=0001C200, R12=000100A1
     R13=00000000, R14=020E0014, SPSR=0091FF64
USR: R8 =021E8000, R9 =0001C200, R10=000100A1, R11=00000000, R12=020E0014
     R13=74EBFF3F, R14=88CF1BAA
FIQ: R8 =D5414CD5, R9 =C2C0BE88, R10=BF81059E, R11=B1E909E0, R12=B59B17CF
     R13=E0D763BF, R14=4945FC6E, SPSR=3F0ADED2
IRQ: R13=D68B397E, R14=1DBD7DCF, SPSR=670467EF
SVC: R13=0091FF64, R14=00002F4B, SPSR=000001D3
ABT: R13=DA163F5A, R14=79EBF7E5, SPSR=C50E1756
UND: R13=F0F71639, R14=618DCCFE, SPSR=C907A3EA
J-Link>s
J-Link>s
00000004:  1C F0 9F E5        LDR     PC, [PC, #+0x1C]    ; 0x00000028
J-Link>halt
PC: (R15) = 0091FFBC, CPSR = 400001DB (UNDEF mode, ARM FIQ dis. IRQ dis.)
Current:
     R0 =00000000, R1 =00900A30, R2 =10000000, R3 =00000800
     R4 =00000000, R5 =00000002, R6 =00900BC4, R7 =02020000
     R8 =00000040, R9 =00000040, R10=021E8000, R11=0001C200, R12=000100A1
     R13=00000000, R14=020E0014, SPSR=F0F71639
USR: R8 =021E8000, R9 =0001C200, R10=000100A1, R11=00000000, R12=020E0014
     R13=74EBFF3F, R14=88CF1BAA
FIQ: R8 =D5414CD5, R9 =C2C0BE88, R10=BF81059E, R11=B1E909E0, R12=B59B17CF
     R13=E0D763BF, R14=4945FC6E, SPSR=3F0ADED2
IRQ: R13=D68B397E, R14=1DBD7DCF, SPSR=670467EF
SVC: R13=0091FF64, R14=00002F4B, SPSR=000001D3
ABT: R13=DA163F5A, R14=79EBF7E5, SPSR=C50E1756
UND: R13=F0F71639, R14=00907002, SPSR=400001F3
J-Link>s
0091FFBC:  1C F0 9F E5        LDR     PC, [PC, #+0x1C]    ; 0x0091FFE0
J-Link>s
00011050:  20 11 9F E5        LDR     R1, [PC, #+0x120]   ; 0x00011178
J-Link>halt
PC: (R15) = 00011054, CPSR = 400001DB (UNDEF mode, ARM FIQ dis. IRQ dis.)
Current:
     R0 =00000000, R1 =020DC2AC, R2 =10000000, R3 =00000800
     R4 =00000000, R5 =00000002, R6 =00900BC4, R7 =02020000
     R8 =00000040, R9 =00000040, R10=021E8000, R11=0001C200, R12=000100A1
     R13=00000000, R14=020E0014, SPSR=F0F71639
USR: R8 =021E8000, R9 =0001C200, R10=000100A1, R11=00000000, R12=020E0014
     R13=74EBFF3F, R14=88CF1BAA
FIQ: R8 =D5414CD5, R9 =C2C0BE88, R10=BF81059E, R11=B1E909E0, R12=B59B17CF
     R13=E0D763BF, R14=4945FC6E, SPSR=3F0ADED2
IRQ: R13=D68B397E, R14=1DBD7DCF, SPSR=670467EF
SVC: R13=0091FF64, R14=00002F4B, SPSR=000001D3
ABT: R13=DA163F5A, R14=79EBF7E5, SPSR=C50E1756
UND: R13=F0F71639, R14=00907002, SPSR=400001F3
J-Link>s
00011054:  00 10 91 E5        LDR     R1, [R1]
J-Link>s
00011058:  00 00 51 E3        CMP     R1, #0x00
J-Link>s
0001105C:  02 00 00 1A        BNE     #+0x08              ; 0x0001106C
J-Link>
Can anyone recommend additional debugging steps? Other than checking that the application was downloaded OK and PC set properly, I'm not sure how to determine what is happening here.
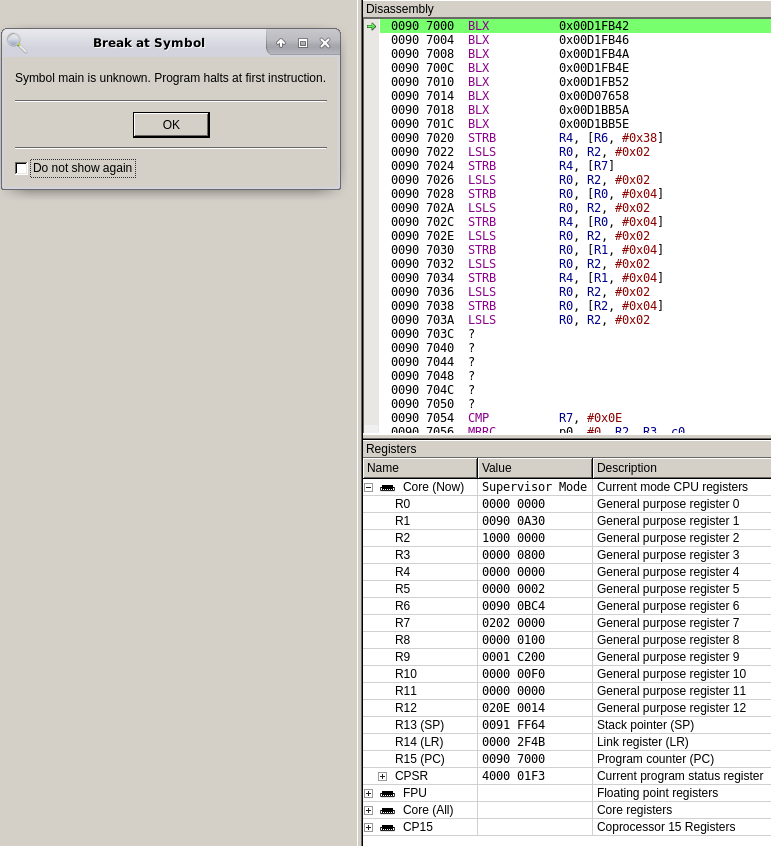
EDIT: The following figure shows Ozone debugger after target connection is initialized:
 When I single step, it jumps to a seemingly random address and then my binary does not execute properly if I hit "Resume program execution". Perhaps that's related to the BLX instruction shown above?
