0
\$\begingroup\$

I was doing exercises of the book Electrical Engineering Fundamentals by Vincent Del Toro. Then I saw this question.

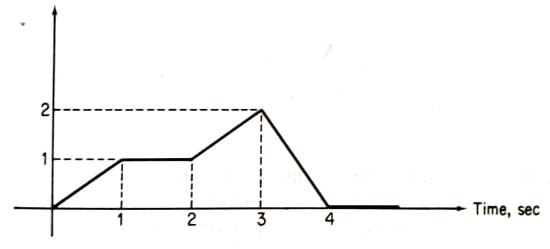
The voltage waveform shown in fig is applied separately to a pure capacitor of 1 F and to a pure inductor of pure of 1 H. Carefully sketch the current waveshape for each circuit element over the specified time interval. Hint : A graphical approach may be found easier than an analytical one.

Voltage waveform

The problem I have is that I am able to solve it only by the analytical approach, then I plot the graph. I can't think how a direct graphical approach can be applied. I will be grateful for your help.

\$\endgroup\$
4
  • \$\begingroup\$ Welcome to EE.SE. If this is a time domain event capture it with a CT (check Pearson Electronics, CA for precision CT's) and a oscilloscope. For long events you may have to use a data logger. \$\endgroup\$
    – user105652
    Commented Sep 6, 2018 at 6:16
  • \$\begingroup\$ The analytical and graphical approaches are in fact the same. Just don’t let you misguide yourself by that hint that they are different. Instead, show us your analytical approach... \$\endgroup\$ Commented Sep 6, 2018 at 20:41
  • \$\begingroup\$ @Stefan It's been a while I used MathJax. Can you help me? \$\endgroup\$
    – Basit
    Commented Sep 7, 2018 at 11:29
  • 1
    \$\begingroup\$ See this MathJAX post for a most stuff. On EE.SE use $$ tags for on-their-own-line equations and \$for inline equations. \$\endgroup\$
    – Transistor
    Commented Sep 7, 2018 at 16:52

2 Answers 2

1
\$\begingroup\$

enter image description here

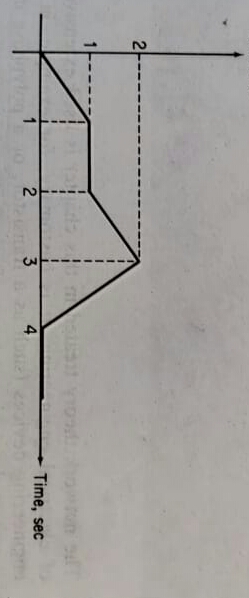
Figure 1. Look, Mama, I rotated the picture! Graph of voltage vs time.

We'll need a little theory to help.

The capacitor

$$ Q = CV \tag 1 $$

Differentiating both sides gives us the rate of charge flow which is the current:

$$ I = \frac {dQ}{dt} = C \frac {dV}{dt} \tag 2 $$

  • We know from basic calculus that \$ \frac {dV}{dt} \$ is the slope of the line. If the slope is constant over a time period then the current must be constant during that period.
  • The direction of the current will match the sign of the slope. Line sloping upwards means current in. Line sloping downwards means current out.
  • If the line is horizontal then \$ \frac {dV}{dt} = 0 \$ and therefore \$ I = 0 \$.

You should now be able to draw the curve for capacitor current.

The inductor

$$ V = L \frac {dI}{dt} \tag 3 $$

  • From (3) we can see that any time V is constant that \$ \frac {dI}{dt} \$ is constant. This means that for a constant non-zero voltage the current will continue to increase linearly with time. This part is counter-intuitive to some extent because in the back of our minds we remember that real inductors have internal series resistance. For this exercise we have to remember that ideal inductors have no internal resistance and so, with a constant voltage, the current can increase to infinity. That's the level part of the graph sorted out.

To be continued ...
\$\endgroup\$
2
  • \$\begingroup\$ But how can we draw the curve of inductor by only that information? \$\endgroup\$
    – Basit
    Commented Sep 8, 2018 at 14:33
  • \$\begingroup\$ Add your solution for the capacitor into your question and whatever parts of the inductor solution you can answer. I'll add more later. \$\endgroup\$
    – Transistor
    Commented Sep 8, 2018 at 14:39
0
\$\begingroup\$

Ok, I will give you a quick starter: Let's consider the the 1F cap. The voltage in the first segment of the graph goes straight from 0V to 1V in 1 second. You want to know the current I, which is the derivative of the voltage (=1V/s) times the capacity (1F) which results in I=1A (Formula: I=C*dU/dt) For the next segment, the derivative of the voltage is zero, so the current will also be zero. You do the rest...

\$\endgroup\$

Your Answer

By clicking “Post Your Answer”, you agree to our terms of service and acknowledge you have read our privacy policy.

Not the answer you're looking for? Browse other questions tagged or ask your own question.