4
\$\begingroup\$

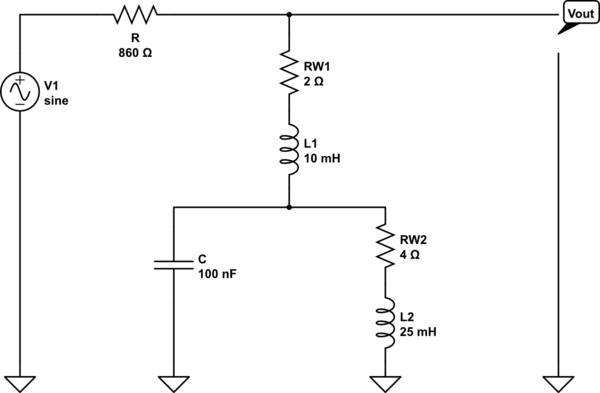
What are the resonant frequencies in the following circuit?

Full disclosure: this is question 34 on page 655 of Pearson's Electronics Fundamentals 8th Ed.

I recognise the parallel section comprising \$C, R_{W_1}\$ and \$L_2\$ and compute a resonance at 2599Hz using \$f_r = \frac{1}{2\pi\sqrt{LC}}\$, and find \$V_{out} = 9.8\$V (given \$V_1 = 10V\$) at this frequency because the parallel section is equivalent to a single \$41671\Omega\$ resistor.

However, the question implies that there is more than one resonant frequency... what are the others and how are they deduced?

schematic

simulate this circuit – Schematic created using CircuitLab

\$\endgroup\$
1
  • 4
    \$\begingroup\$ There is also a series resonant circuit - look for it. \$\endgroup\$
    – Andy aka
    Commented May 16, 2020 at 16:22

4 Answers 4

5
\$\begingroup\$

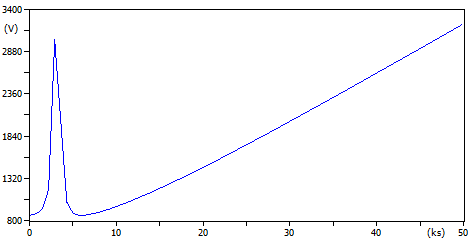
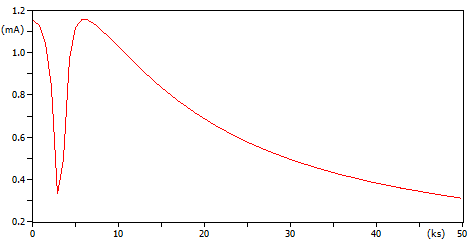
One way to determine the resonant frequencies is via simulation. You can apply a 1V source at various frequencies (e.g. start at 100Hz and increment). Then plot the current provided by the source vs. frequency (admittance plot). You can apply a 1A source as well, then plot the voltage at terminals of source vs. frequency (impedance plot).

I did both for your circuit in ATPDraw (gui for ATP) and they are plotted below (swept from 100Hz to 50kHz in 100Hz steps).

First one is impedance plot, since we are injecting 1A the vertical axis (which is labeled V) is equivalent to Z. Peak is around 2.9kHz (horizontal axis is frequency).

enter image description here

You can narrow it down once you have roughed out where the peaks are. Below is the plot of current vs. frequency when source is 1V. This is admittance plot.

enter image description here

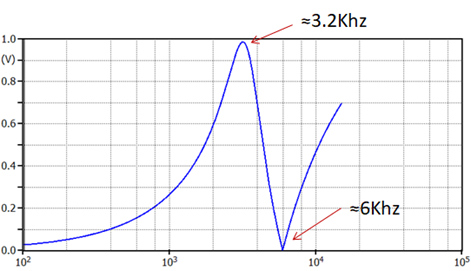
UPDATE: Based on Tony Stewart's tutoring my plot below is Vout/Vin instead of input impedance/admittance like i show above. This one is logarithmic on horizontal axis.

enter image description here

\$\endgroup\$
7
  • \$\begingroup\$ Very helpful, thanks! Do you think my analysis of the tank circuit as resonating at 2.6kHz is correct? The simulation shows a peak at somewhat higher frequency, but perhaps the total impedance of the Vout part of the voltage divider occurs at a higher frequency than the resonance of the tank circuit due to L_1's reactance increasing with frequency? \$\endgroup\$
    – kikazaru
    Commented May 16, 2020 at 18:30
  • \$\begingroup\$ Hi @kikazaru, you are very welcome. No, i get 3.2kHz using the same formula (which is correct) you show in your question. To get the other resonance (6kHz) i put the two inductors in parallel (equivalent 7.1mH) and use the formula with 100nF cap. \$\endgroup\$ Commented May 16, 2020 at 19:14
  • \$\begingroup\$ Ah yes, I made a mistake in my calculation and the formula indeed gives me 3.2kHz. I also get 6kHz if I convert the two inductors into a single inductor as \$(L_1^{-1} + L_2^{-1})^{-1} = 7.1mH\$. NB: that's the serial (rather than parallel) combination of two inductors. I don't understand why it's legit to simplify the inductors into one in that way, given that the cap is only in parallel with one of them. Can you explain why that's ok? \$\endgroup\$
    – kikazaru
    Commented May 16, 2020 at 20:49
  • \$\begingroup\$ Kill other sources to analyze. For this case that means shorting out the voltage source to the left. Then you will see the circuit. Using same approach you ignore the upper inductor when looking at the tank circuit resonance (think of inductor as current source which we open up to kill). \$\endgroup\$ Commented May 16, 2020 at 22:00
  • 1
    \$\begingroup\$ If the source is shorted/disregarded, then \$L_1, L_2\$ and \$C\$ are all in parallel and we have a loop through \$C\$ and \$L_1 \parallel L_2\$ (which yields the 6kHz resonance because \$L_1 \parallel L_2\$ is 7.1mh). There is also a loop through \$C\$ and \$L_2\$ (yielding 3.2kHz resonance), but there is also a loop through \$C\$ and \$L_1\$ which should yield a resonance at 5033 Hz (but there isn't). Why isn't this loop resonant? (please!) \$\endgroup\$
    – kikazaru
    Commented May 17, 2020 at 18:19
6
\$\begingroup\$

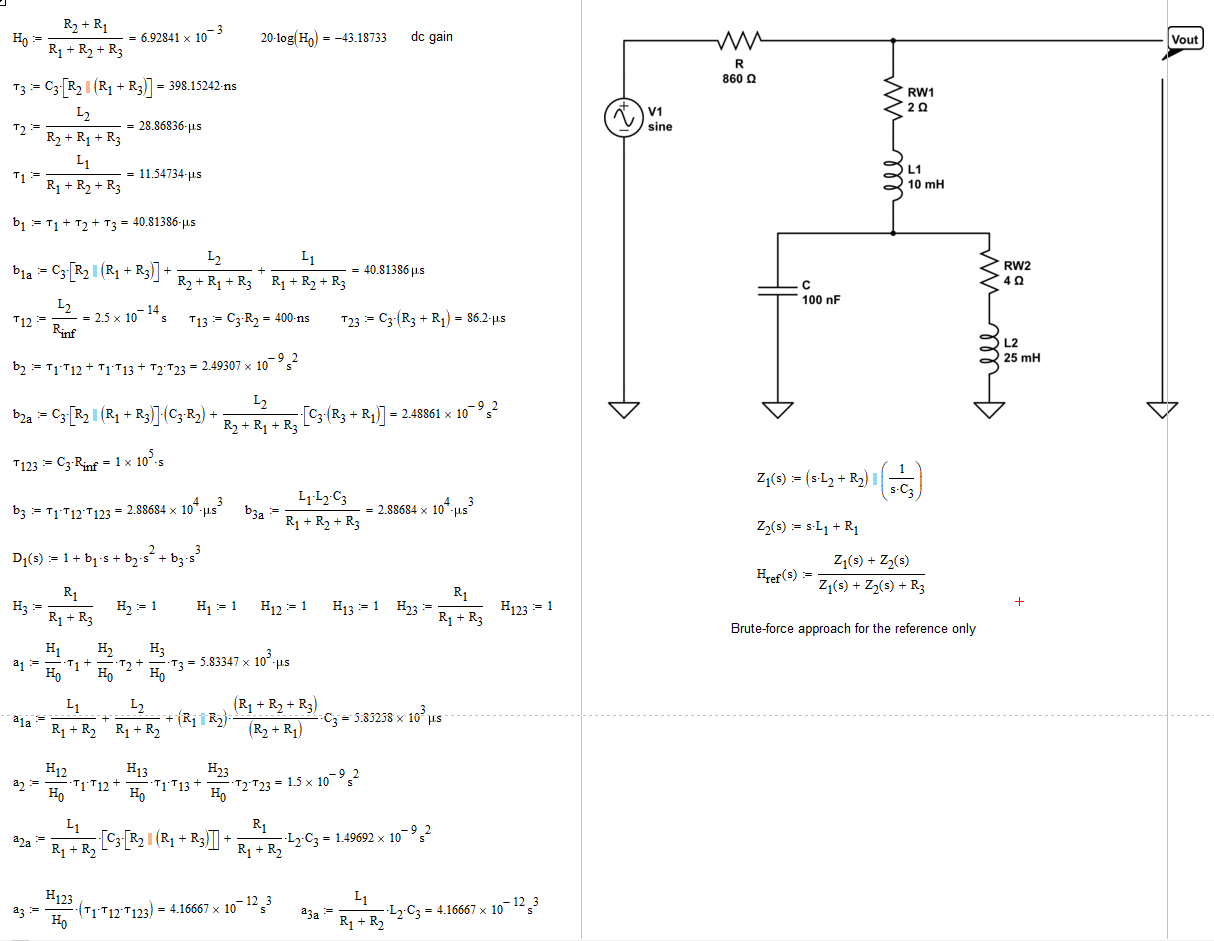
The fun is in determining the transfer function (TF) symbolically otherwise you don't know what elements contribute to the resonant frequencies. You can use the brute-force analysis to determine this TF - good luck with that - or use the fast analytical circuits techniques or FACTs described in the book I published. By determining the time constants of this circuit by inspection (no algebra at all) and assembling them at the end, you determine the TF of this 3rd-order network.

The various time constants are here:
enter image description here

and the final transfer function is here:
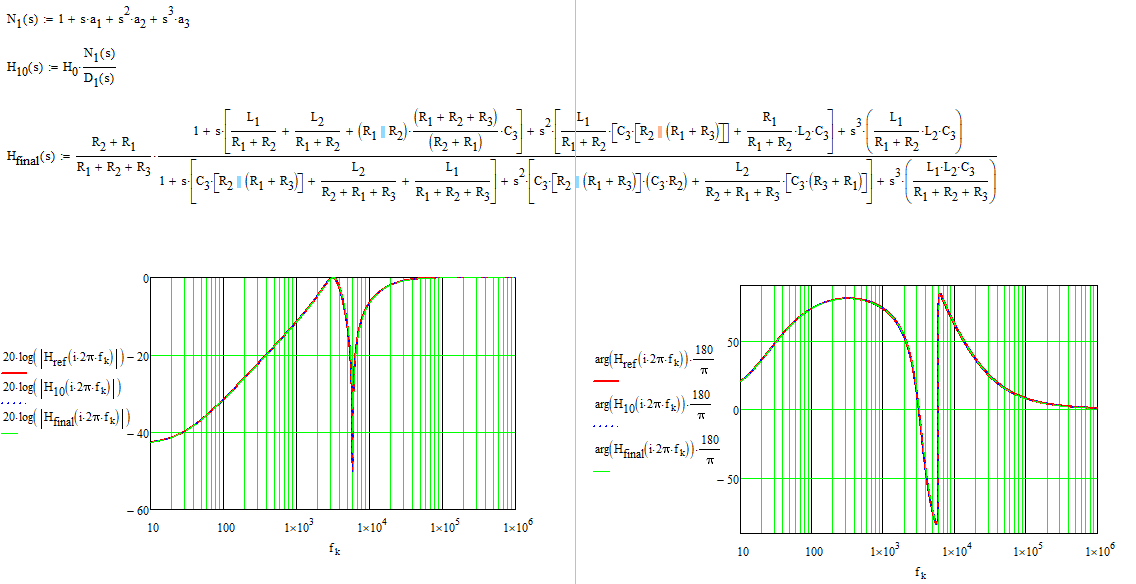
enter image description here

So there are three zeroes and three poles. The more difficult exercise is to factor this beast in a second-order polynomial multiplied by a low-frequency pole and zero. Once this is done, you can determine analytically the resonant frequencies you want:
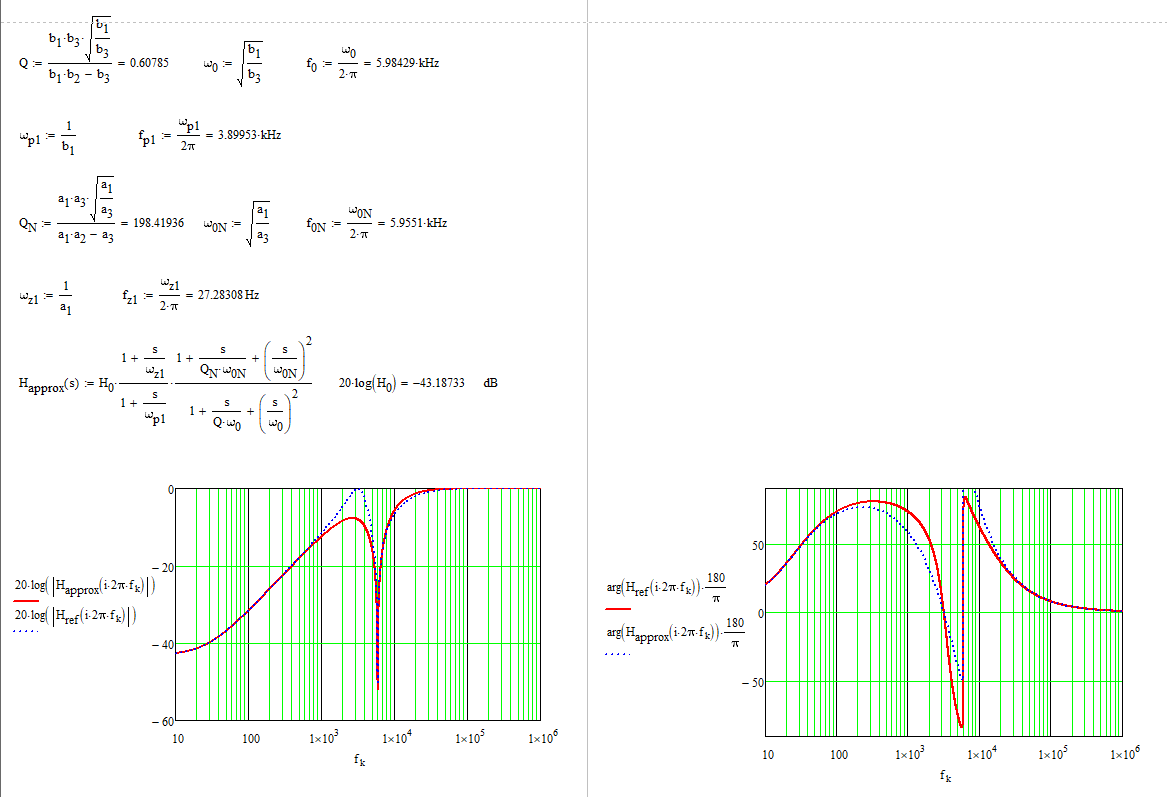
enter image description here

This is an approximated expression and you can see a dc attenuation of 48.2 dB and a notch appearing at 6 kHz.

Addendum

To show you the principle behind the small sketches, I have added below the steps I used to determine the denominator poles and the high-frequency gains. For the poles, you reduce the excitation \$V_{in}\$ to 0 V (replace the symbol by a short circuit) and you temporarily disconnect the considered energy-storing element. You then "look" through its connecting terminals to see the resistance \$R\$. Then, depending if it is a capacitor or an inductor, you have \$\tau=RC\$ or \$\tau=\frac{L}{R}\$. With passive circuits like in this example, you can inspect the circuit and simply find the resistance by reading the arrangement: no algebra and easy corrections if necessary.

For the numerator, you can either go through a null double injection (NDI) or determine high-frequency gains \$H\$. These high-frequency gains allow me to re-use the natural time constants (the \$RC\$ and \$\frac{L}{R}\$ values) to determine the numerator. Simply put, it is an excellent means to "see" if any energy-storing element contributes a zero: place the considered element in its high-frequency state (a short for a capacitor or an open circuit for an inductor) and check if there is a non-zero gain \$H\$ linking \$V_{in}\$ to \$V_{out}\$. If there is a gain, meaning that the stimulus in this mode can propagate and create a response, the tested element contributes zero. Without doing anything on this circuit, you can immediately count 3 zeros there.
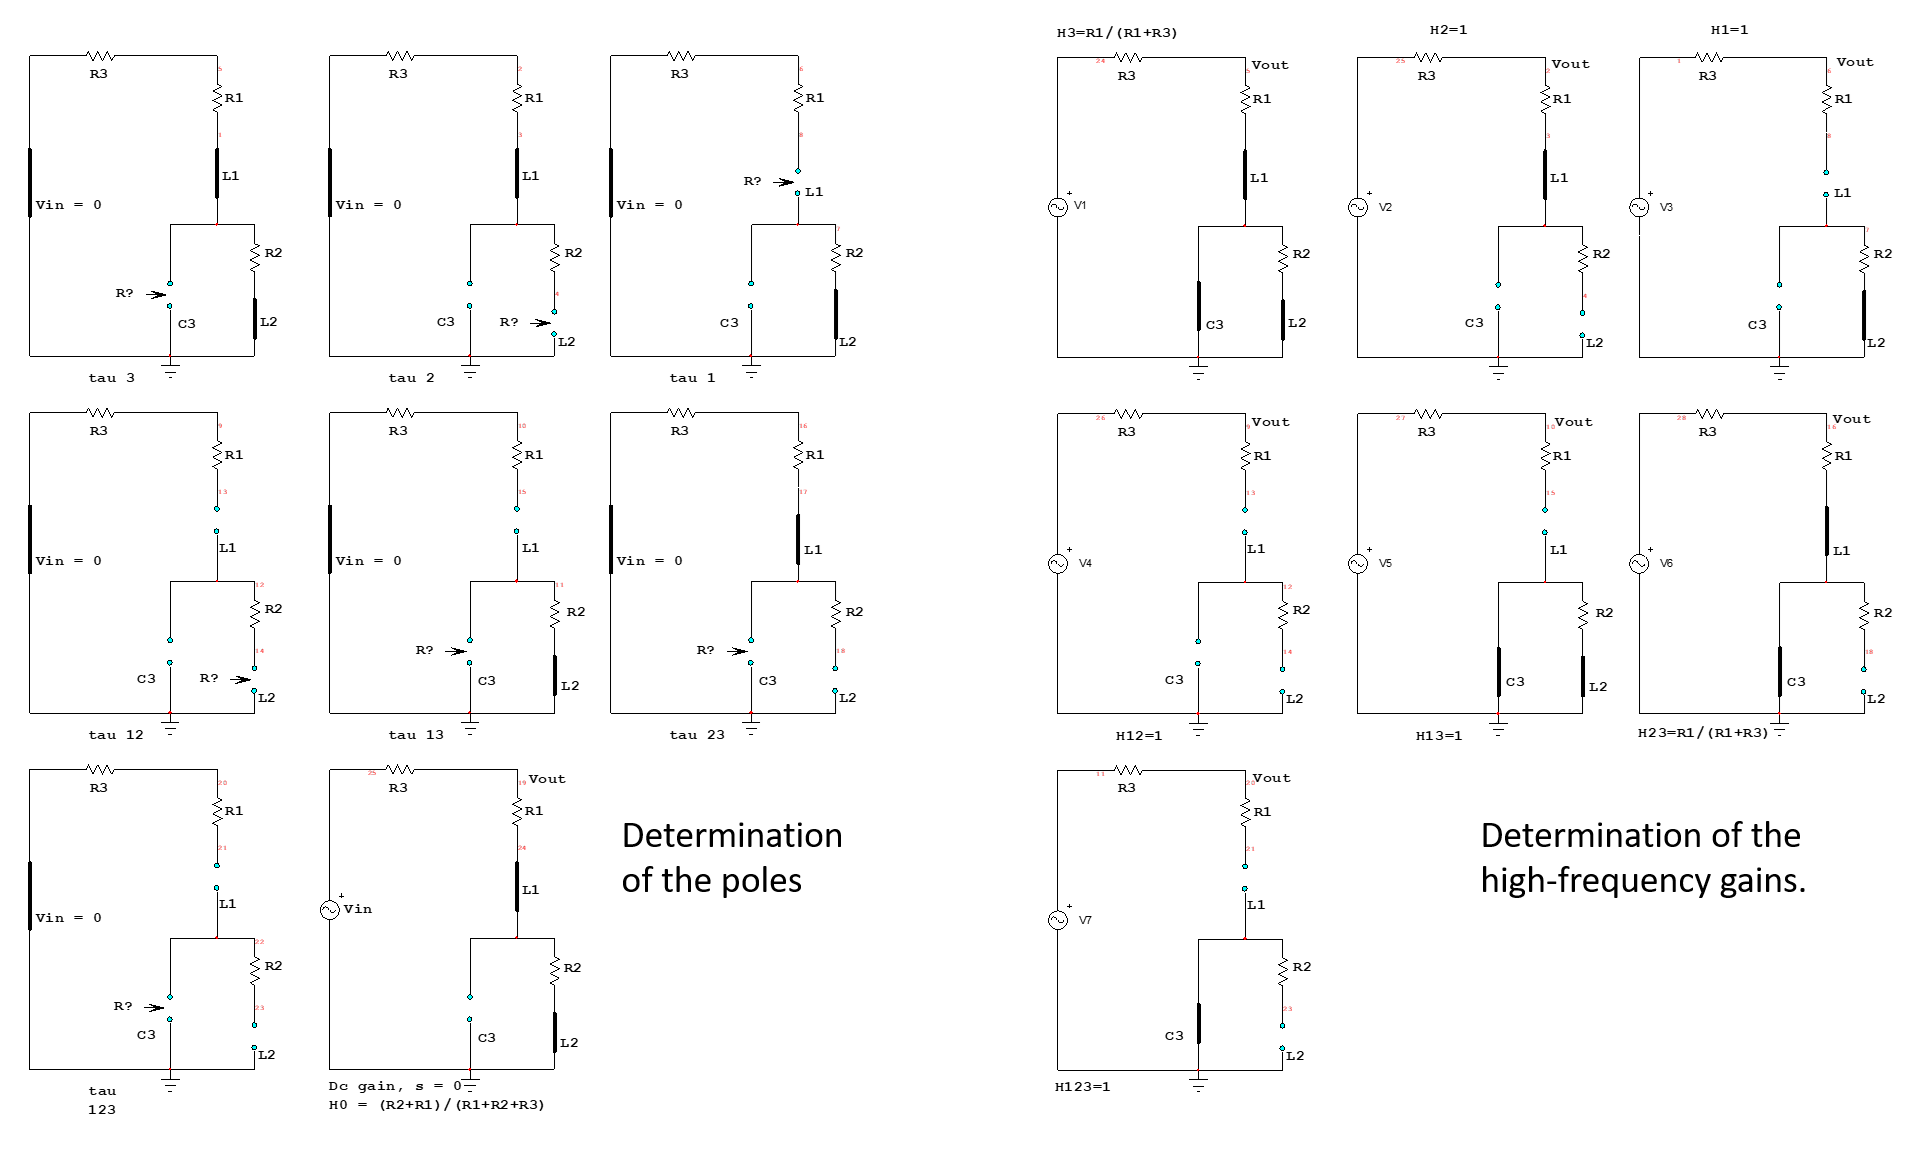
enter image description here

The other difficult thing is to factor the raw polynomial into meaningful expressions where poles, zeroes and resonant frequencies appear. It is not always easy as factorization depends on the time constants and how they compare with each other. For instance, it seems possible to define three separated poles considering three distinct positions. The plots show a fairly good approximation with the full-blown expression:
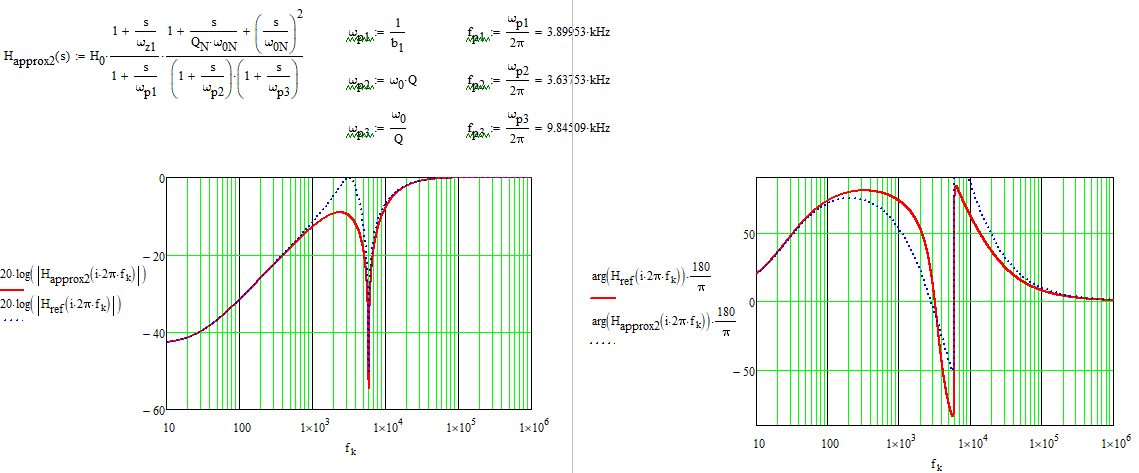
enter image description here

I recommend to read this document written by Prof. Erickson from Colorado Edu which explains in details how to do it.
\$\endgroup\$
2
  • \$\begingroup\$ Outstanding! Laplace is way to go for closed form solution but it gets unwieldy fast as you add storage elements and branches. Of course, matrix approach makes it easier but need tool to help (Matlab/Mathcad etc). Anyway, your solution is very nice. P.s. just bought copy of your book. \$\endgroup\$ Commented May 16, 2020 at 22:32
  • 2
    \$\begingroup\$ Thank you, this method is extremely useful in analyzing passive and active circuits. You can even test every step with a SPICE sim to verify your calculations. If you spot a deviation between the reference brute-force result and that of the FACTs, you can correct the faulty intermediate sketch without restarting from scratch. Matrices are ok for a numerical result but the FACTs get you to the well-ordered low-entropy form I obtain at the end. If you start from the beginning, petit à petit then you will quickly acquire the skill. Good luck! \$\endgroup\$ Commented May 17, 2020 at 8:10
4
\$\begingroup\$

Any closed path, with series inductor(s) and series capacitor(s), will resonate.

In a simulation you may not see the resonance IF the Q is too low.

Note "closed path" is required, so the bimodal energy ( exchanging between electric field and magnetic field energy storage) is part of the circuit behavior.

To see these modes, make the Qs very high.

Change those 4 ohm resistors to 0.004 ohms.

And that resistor from the source also dampens --- make it 10x higher (if needed)

=============================

resonant LOOPS are

  • L1+C, though this loop is very damped by "R"

  • L2+C

\$\endgroup\$
2
  • \$\begingroup\$ Thanks! Very helpful insight. I'm not sure how to compute the resonant frequency of the L1+C loop. Analysing as an isolated serial circuit yields 4109Hz (since \$fr = 1/2\pi\sqrt{LC}\$) but at this frequency I get 258.2 ohms for L1 and C, 645.5 ohms for L2, and find currents of 11.4mA @ 11.3 deg, and 19.0mA @ 11.5 deg for L1 and C respectively. So they don't appear to be resonating at this frequency. \$\endgroup\$
    – kikazaru
    Commented May 16, 2020 at 18:40
  • \$\begingroup\$ Yes, this was helpful, thanks @analogsystemsrf. \$\endgroup\$ Commented May 17, 2020 at 1:25
2
\$\begingroup\$

This only takes a few minutes to see where your and @relayman357 's error are.

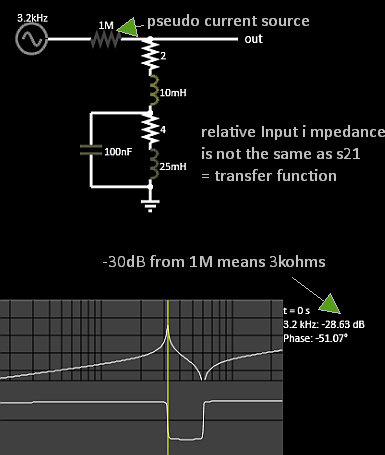
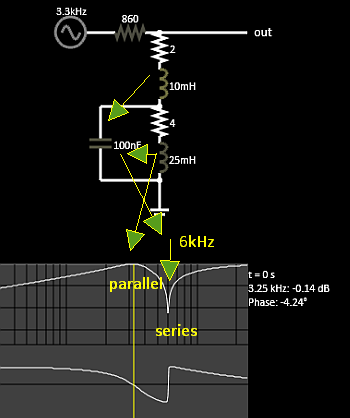
enter image description here

Andy was correct about the series parallel effects.

The top L mainly controls the series pole but is low Q. The bottom L controls both pole and zero and the zero appears deep but -3dB is about the same for Pole and zero.

So the peak gain is at 3.1kHz and notch at 6.0 kHz but this not what you want.

The problem mainly is you did not specify or ask for what you should have wanted. i.e. a design spec.

enter image description here

e.g. Design Spec.

  • fbp = 3kHz BW = tbd ?
  • fbs = 6kHz BW = tbd @ -3dB and
    • BW = tbd at -xx tbd dB

Simulated Proof of Concept (without specs)

\$\endgroup\$
5
  • \$\begingroup\$ Thank you Tony. Why did you use a 1M resistor in your top circuit? \$\endgroup\$ Commented May 16, 2020 at 18:11
  • \$\begingroup\$ Pseudo current source to measure Impedance ratio with a Bode Plotter on a log-log scale \$\endgroup\$
    – D.A.S.
    Commented May 16, 2020 at 18:19
  • \$\begingroup\$ Sorry, this is new ground for me. Would you not just plot Vo/Vi? I'm not seeing your method. \$\endgroup\$ Commented May 16, 2020 at 18:25
  • \$\begingroup\$ Huh I plotted both. S21 and S11. ThatisVo/Vi and Vi/Ii where that is simply the voltage after 1M = I*Rin scaled down by Impedance ratio \$\endgroup\$
    – D.A.S.
    Commented May 16, 2020 at 21:58
  • \$\begingroup\$ Got it, thank you sir. \$\endgroup\$ Commented May 16, 2020 at 22:01

Your Answer

By clicking “Post Your Answer”, you agree to our terms of service and acknowledge you have read our privacy policy.

Not the answer you're looking for? Browse other questions tagged or ask your own question.