My question involves calculating the frequency drop in a power grid when a load is lost. The closest question I have found to mine is, Change in frequency in a grid that has lost generation?
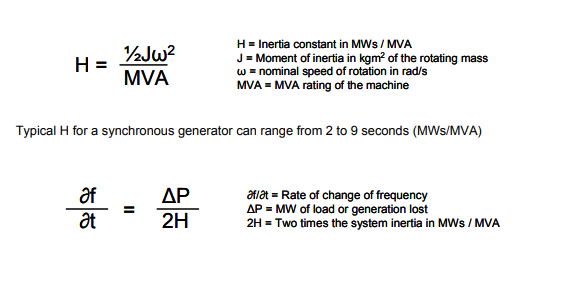
Based on my research I have found the following equations.
I am interested in how I use the second equation, which would be the rate of change of the frequency based on how much load is lost. If the equation works the way I believe it does, then the units on the left side are Hz/s and the units on the right side would be MW/s. I am not sure how I can calculate the frequency drop using this equation, especially because each side seems to have different units. Maybe I am looking at the equation wrong, and the right side is supposed to be a sort of "scalar"? I think I am looking at this too much from a number standpoint and not enough from the stand point of what is "physically" happening when a load is lost. Here is the link for the National Grid power point presentation that presents the equation on page 6, the slide is titled, "The maths behind inertia", (https://www.nationalgrid.com/sites/default/files/documents/16890-Meeting%208%20-%20Inertia%20presentation.pdf).
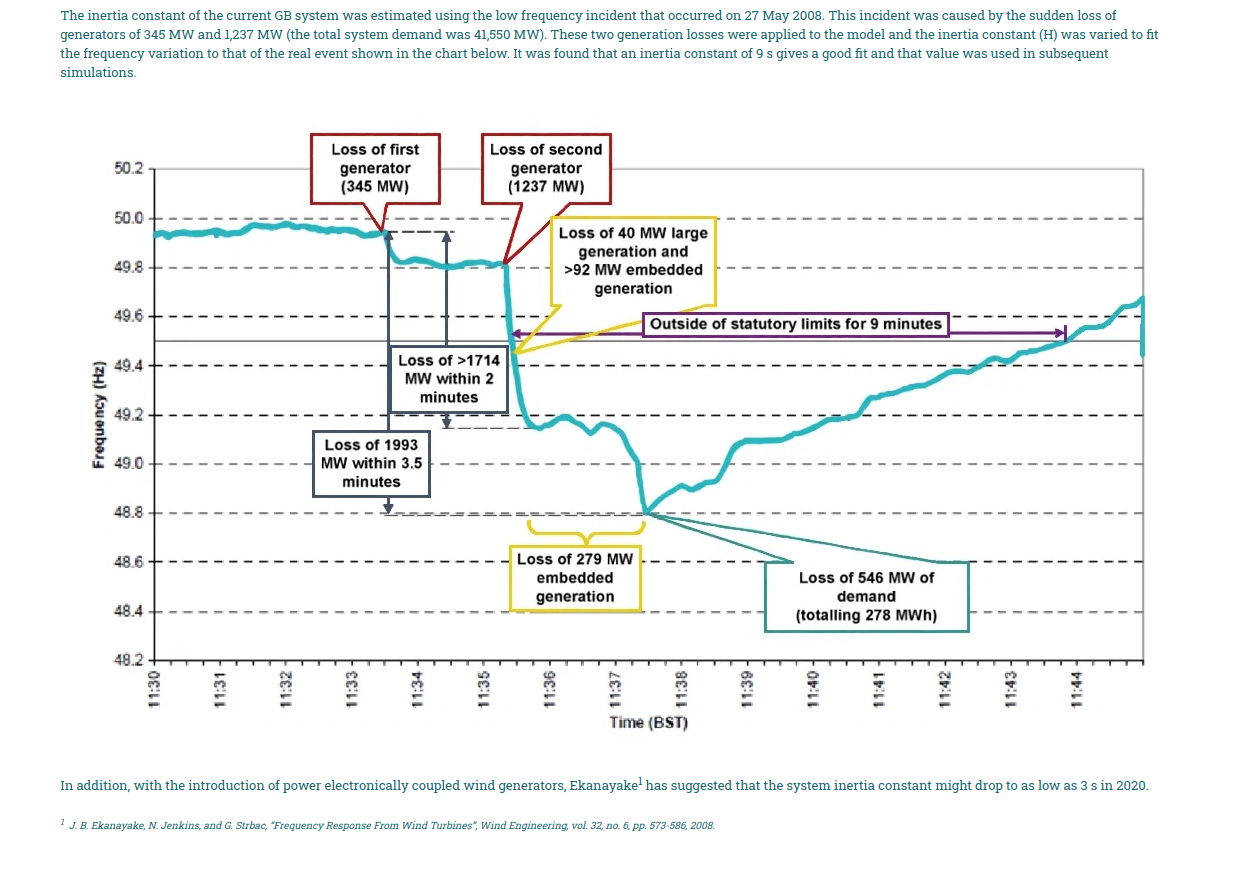
I am trying to apply the equation to the figure below:
I believe in the thesis, the author used a value of 9 seconds for H, as they state that, "It was found that an inertia constant of 9 s gives a good fit and that value was used in subsequent simulations." I obtained the figure from an online article titled "Measuring grid inertia accurately will enable more efficient frequency management" (http://watt-logic.com/2017/10/12/inertia/). The original source for the figure is a thesis titled, "Use of Smart Meters for Frequency and Voltage Control" by Kamalanath Bandara Samarakoon. The figure itself is on page 73 of the thesis, Figure 4.11.
If I am reading the figure correctly, for the first generator loss (345MW), it looks like the time interval is about 25 seconds, 11:33:50 to 11:33:75 (HH:MM:SS), and the frequency drops from what looks like 49.95Hz to 49.8Hz.
Another source I have been using to understand the equation is a NREL paper titled "Grid Frequency Extreme Event Analysis and Modeling" that has similar equations (Equations 2 and 3) to the ones I presented earlier, however, I am still having trouble understanding how the equations were used to produce the figures for frequency drop as a result of lost load, https://www.nrel.gov/docs/fy18osti/70029.pdf
Further Questions
- If the equations can be used to calculate frequency drop from a lost load, can they also be used to calculate how the frequency would increase if a load was added? Is it a matter of a positive, or negative sign in front of the delta P?
- How does MW*s/MVA (inertia constant) on the right side of the equation "cancel" to just seconds? Why do you have MW over the rating of the machine MVA? I think this is meant to be a "ratio"?
I am hoping someone can give me an example calculation on how much the frequency would drop based on how much generation was lost using the aforementioned equation. And explain how a change of rate in frequency (HZ/s) on the left side can equal a change in power per second (MW/s) on the right side.
If clarification is needed on my question, please let me know. And let me know if I am using the wrong equation for what I am trying to solve.


x[k+1]-x[k]), which will whow the variation of frequency in terms of delivered power (itself a function of time). See if that gets you somewhere. \$\endgroup\$