1
\$\begingroup\$

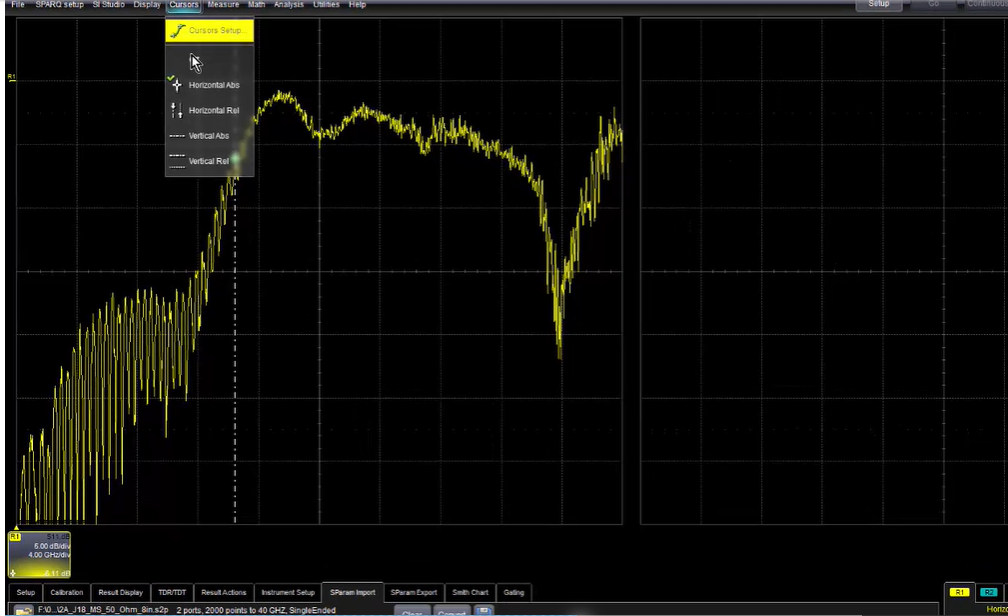
Below we see the S11 plot of a transmission line, the Wikipedia definition of the reflection coefficient as a function of S-params.

As I see it, the S-param frequency domain plot comes from the time domain steady state.

TDR is time domain in every moment from the start (transient).

So how can we convert from S-param (steady state) to TDR (transient)?

enter image description here

enter image description here

enter image description here

\$\endgroup\$
9
  • \$\begingroup\$ "TDR" means "time domain reflectometry" and you seem to be implying there is a specific formula directly attached to the phrase "TDR". TDR is a technique rather than a formula but, I'm prepared to be wrong so please explain what it is. Maybe you are looking to convert an S parameter to a reflection coefficient? \$\endgroup\$
    – Andy aka
    Commented Mar 14, 2021 at 11:26
  • \$\begingroup\$ Hello Andy ,yes you are correct,by TDR i mean the moment impedance coming to a node using bounce diagram.(transient). i know that in order to convert impedance to S11 and vise versa we use the following formula in the following link: ibb.co/qB2hKsf But S11 is a frequency domain diagram(which i assume come from steady state) so i cant see how its possible to convert between the moment impedance and S11,the one is steady state where moment impedance is transient. \$\endgroup\$
    – ron398
    Commented Mar 14, 2021 at 11:49
  • \$\begingroup\$ You can convert S11 to \$\Gamma_r\$ directly but you cannot know the impedance in the frequency domain because it can have two values. Neither can you use the transient impedance values in the time domain to extract what the frequency domain impedances are. They are different things. You can however, look at the transient signals and estimate what the frequency domain impedance will be (a little tortuous). \$\endgroup\$
    – Andy aka
    Commented Mar 14, 2021 at 11:50
  • \$\begingroup\$ exactly ,that what i am trying to understand. because we have a formula linking reflection coefficient and impedance shown in the link bellow: ibb.co/N9FrWgZ but you say that its not the reflection coefficient from S11. why they are not the same? Could you please explain to the difference between gamma in S11 and Gamma for transient impedance? Thanks. \$\endgroup\$
    – ron398
    Commented Mar 14, 2021 at 12:00
  • \$\begingroup\$ This is also untrue: As i see it S-param frequency domain plot comes from time domain steady state. - the S parameter is done by measuring impedance with a sinewave applied so that the accumulated effect of reflections settles down to an impedance mismatch rather than a bunch of complicated transient reflections. \$\endgroup\$
    – Andy aka
    Commented Mar 14, 2021 at 12:01

3 Answers 3

1
\$\begingroup\$

You get the time domain TDR by taking the inverse transform of the frequency domain S11 data. This is related to the fact that the impulse response of a network is equal to the Fourier transform of its frequency response. Many Vector Network Analyzers have this function built in and usually labeled "Transform". You can find the details by Googling "convert S11 data to TDR". One good source is: https://cdn.rohde-schwarz.com/pws/dl_downloads/dl_application/application_notes/1ez44/1ez44_0e.pdf.

\$\endgroup\$
1
  • \$\begingroup\$ Thank you very much. \$\endgroup\$
    – ron398
    Commented Mar 14, 2021 at 13:25
5
\$\begingroup\$

By taking an Inverse Fourier Transform, it's possible to convert S11 measurements from a VNA to its equivalent time-domain response as measured by a TDR. Previously, this capability is often exclusive in expensive simulation packages or in the firmware of expensive VNAs. Now, with the power of scikit-rf, a free and open source Python software library for RF/microwave modeling and analysis, it's accessible to everyone with basic programming knowledge.

Here's a demo from my recent experiment (this is only meant to be a quick example, the measurement is not fully calibrated and the parameters used for the calculations are not optimized, so please don't complain too much about the data).

To evaluate the impedance discontinuity and signal integrity impact caused by a 1206 resistor footprint, I fabricated a test fixture shown in the picture below.

PCB test board

resistor footprint, with ground plane partially removed

It's a 4-layer circuit board with three solid ground planes. Two through-hole SMA connectors are located on both ends, with a 50-ohm microstrip in between. At the center is the Device Under Test, a 0-ohm, 1206 resistor. Also, to compensate for the excess capacitance caused by the large resistor pads, the ground plane under the resistor body is partially removed.

After I've received the board, I measured its S11 from 10 MHz to 4 GHz using a Vector Network Analyzer. It shows the return loss is good up to 1.2 GHz. But is it the full picture?

Measured S11 data

Using the scikit-rf software library and the following Python code, we can transform the data from frequency domain to time domain.

import sys
import skrf
import matplotlib.pyplot as plt
skrf.stylely()

network = skrf.Network(sys.argv[1])
network_dc = network.extrapolate_to_dc(kind='linear')

plt.figure()
plt.title("Time Domain Reflectometry")
network_dc.s11.plot_z_time_step(window='hamming', label="impedance")
plt.xlim((-0.5, 1.5))

plt.tight_layout()
plt.show()
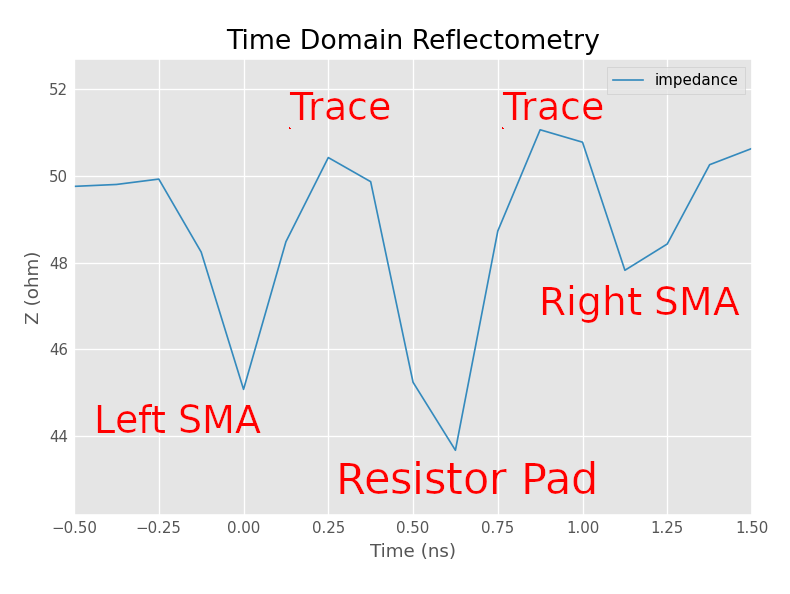
TDR plot

This calculated TDR plot immediately reveals that the test fixture was poorly designed with non-ideal SMA-to-microstrip transitions. When the signal hits the first SMA connector, the instantaneous impedance drops to 45 ohms due to a capacitive discontinuity, then it hits the 50-ohm trace, hits the device-under-test, hits the 50-ohm trace again, and finally hits the second connector.

In fact, after de-embedding, it turned out that the resistor footprint only has 20 dB return loss at 800 MHz, not 1.2 GHz. The bad SMA connector footprints and the resistor footprint actually compensated each other. It would be difficult to spot this problem using the Smith Chart, on the other hand, it's obvious from the computed TDR response.

You can find more information from scikit-rf's documentation, Time domain reflectometry, measurement vs simulation. scikit-rf also supports time-gating, it's possible to use time-gating as a simple way to de-embed the connectors from the DUT by deleting the reflections from the time domain, see Time Domain and Gating.

\$\endgroup\$
2
  • \$\begingroup\$ Do you have the source input of s1p in this example? So that I can test the TDR result with the code. Appreciate. \$\endgroup\$
    – yancyn
    Commented Aug 3, 2022 at 5:51
  • 1
    \$\begingroup\$ @yancyn No problem, you can download it from here. Alternatively, you can also use the data from the official scikit-rf example instead (linked at the end of my answer). Its raw data for that example is located in scikit-rf's official code repository: github.com/scikit-rf/scikit-rf/tree/master/doc/source/examples/… \$\endgroup\$ Commented Aug 4, 2022 at 20:45
0
\$\begingroup\$

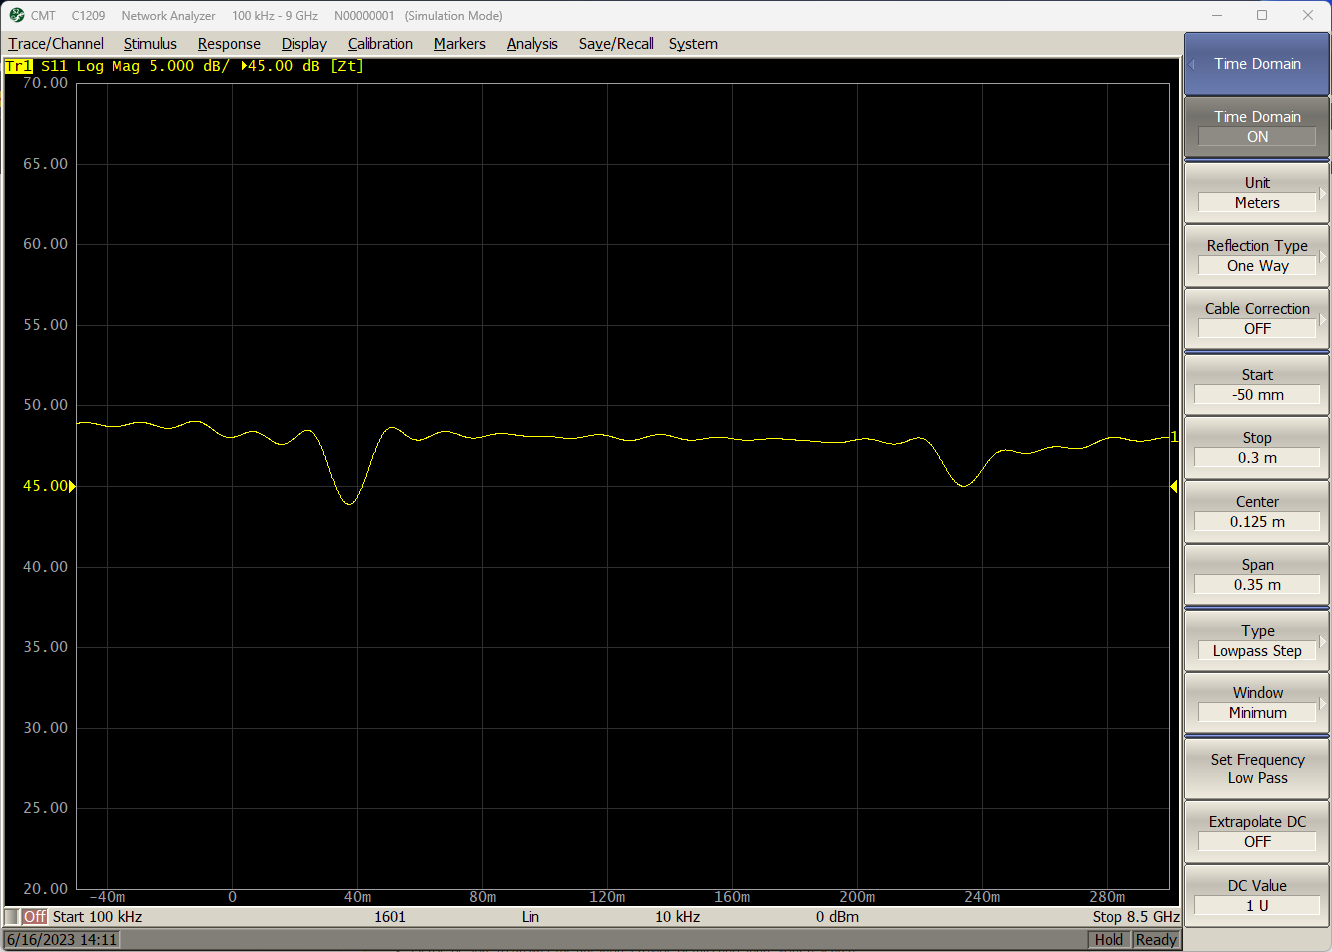
Alternatively, you can download Copper Mountain VNA control software (such as S2VNA) which can run in demo mode (without VNA connected). Software allows importing S1P data and postprocessing it with time domain / gating analysis free of charge.

Here's an example of S11 data of a ~200mm long RG174 cable with SMA connectors on both ends, obtained with a 8.5 GHz Agilent E5071C when using Copper Mountain S2VNA Control software:

enter image description here

\$\endgroup\$

Your Answer

By clicking “Post Your Answer”, you agree to our terms of service and acknowledge you have read our privacy policy.

Not the answer you're looking for? Browse other questions tagged or ask your own question.