5
\$\begingroup\$

When doing system noise calculations using LTspice using the .noise instruction, I can plot the total output noise and I can plot all the individual noise contributions to output noise from all components that contain some resistance (resistors, caps, inductors, voltage sources, even transistors) by clicking on them. But this selection method does not work for opamps.

How can I plot the noise contribution of individual opamps ?

\$\endgroup\$
3
  • \$\begingroup\$ Well, bugger me, I don't know. Maybe you have to run a separate analysis of the opamp, only? If you have to use RLC networks around it, use the noiseless flag for them to avoid contributing to the total result. \$\endgroup\$ Commented May 19, 2021 at 11:50
  • \$\begingroup\$ @aconcernedcitizen An isolated sim of the opamp is not that helpful because the isolated noise might be modified by resonances or other opamps etc. Imagine a frequency splitter, then two opamps (one in each branch), and then joining the amplified signals again. The noise of each one opamp will be influential mostly in high/low frequency spectrum. (this is just a dumb example illustrating the point) \$\endgroup\$
    – tobalt
    Commented May 19, 2021 at 11:55
  • 1
    \$\begingroup\$ True, that's why I was cautious and used "maybe". Best try the LTspice Group, someone might know of a way (registration needed to avoid spammers). \$\endgroup\$ Commented May 19, 2021 at 13:24

1 Answer 1

4
\$\begingroup\$

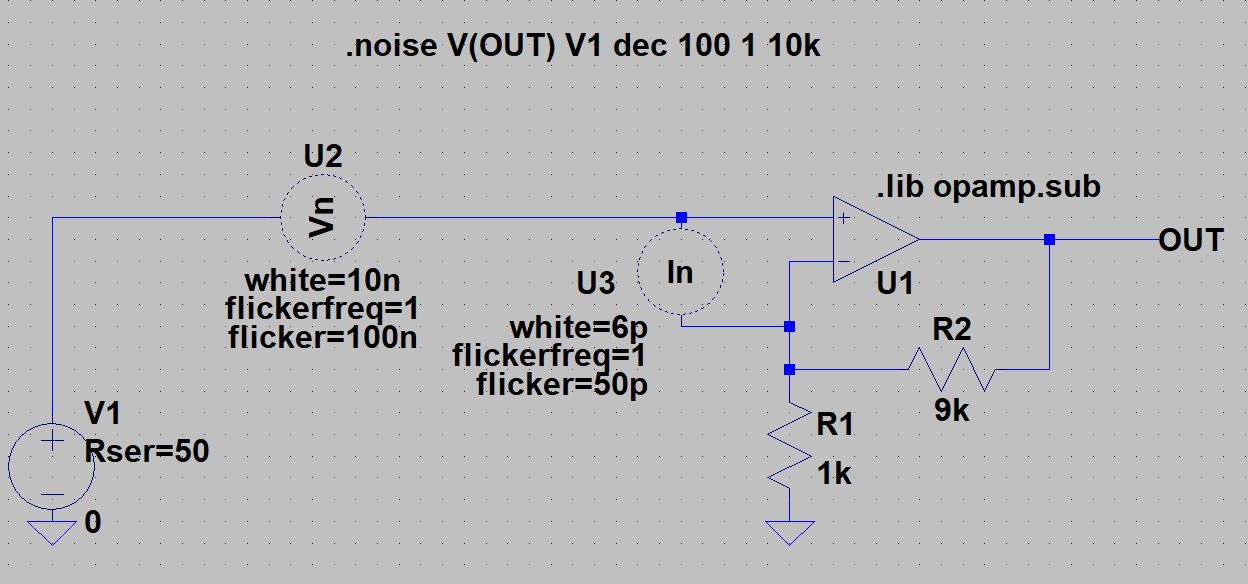
This problem has also been bothering me for quite some time. I found the following solution, which I would like to explain below with an example.

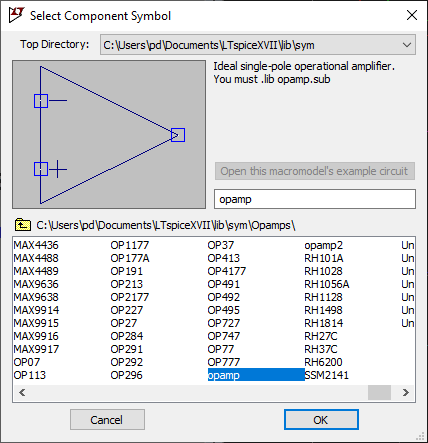
  1. Build your circuit in LTspice, using a noise-free version rather than "real" opamps. I use e.g. the ideal single-pole operational amplifier for which you need to use the additional spice directive .lib opamp.sub. However, other models also work. It is only important that these are noise-free.

1

  1. Equip the operational amplifier with a voltage noise source and/or a current noise source. Since LTspice's library does not include noise sources by default, I created a voltage noise source and a current noise source respectively. These support both white noise and flicker noise. The download of the noise sources and instructions on how to integrate/use them can be found on my GitHub page.

3

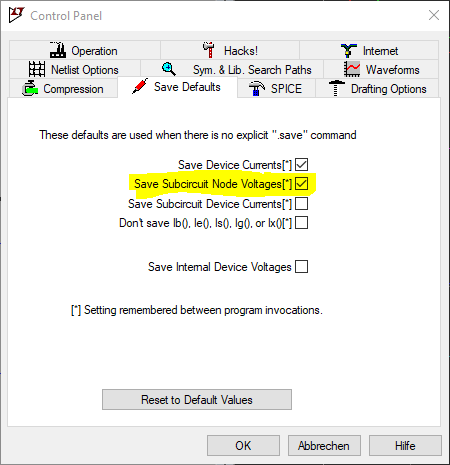
  1. By default, after a simulation in LTspice, only the voltages/currents located at the top level of the schematic can be displayed as a trace. Therefore, Save Subcircuit Node Voltages must be enabled in the LTspice settings.

4

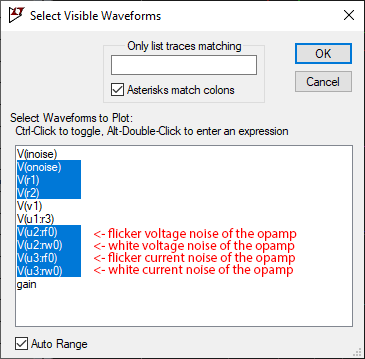
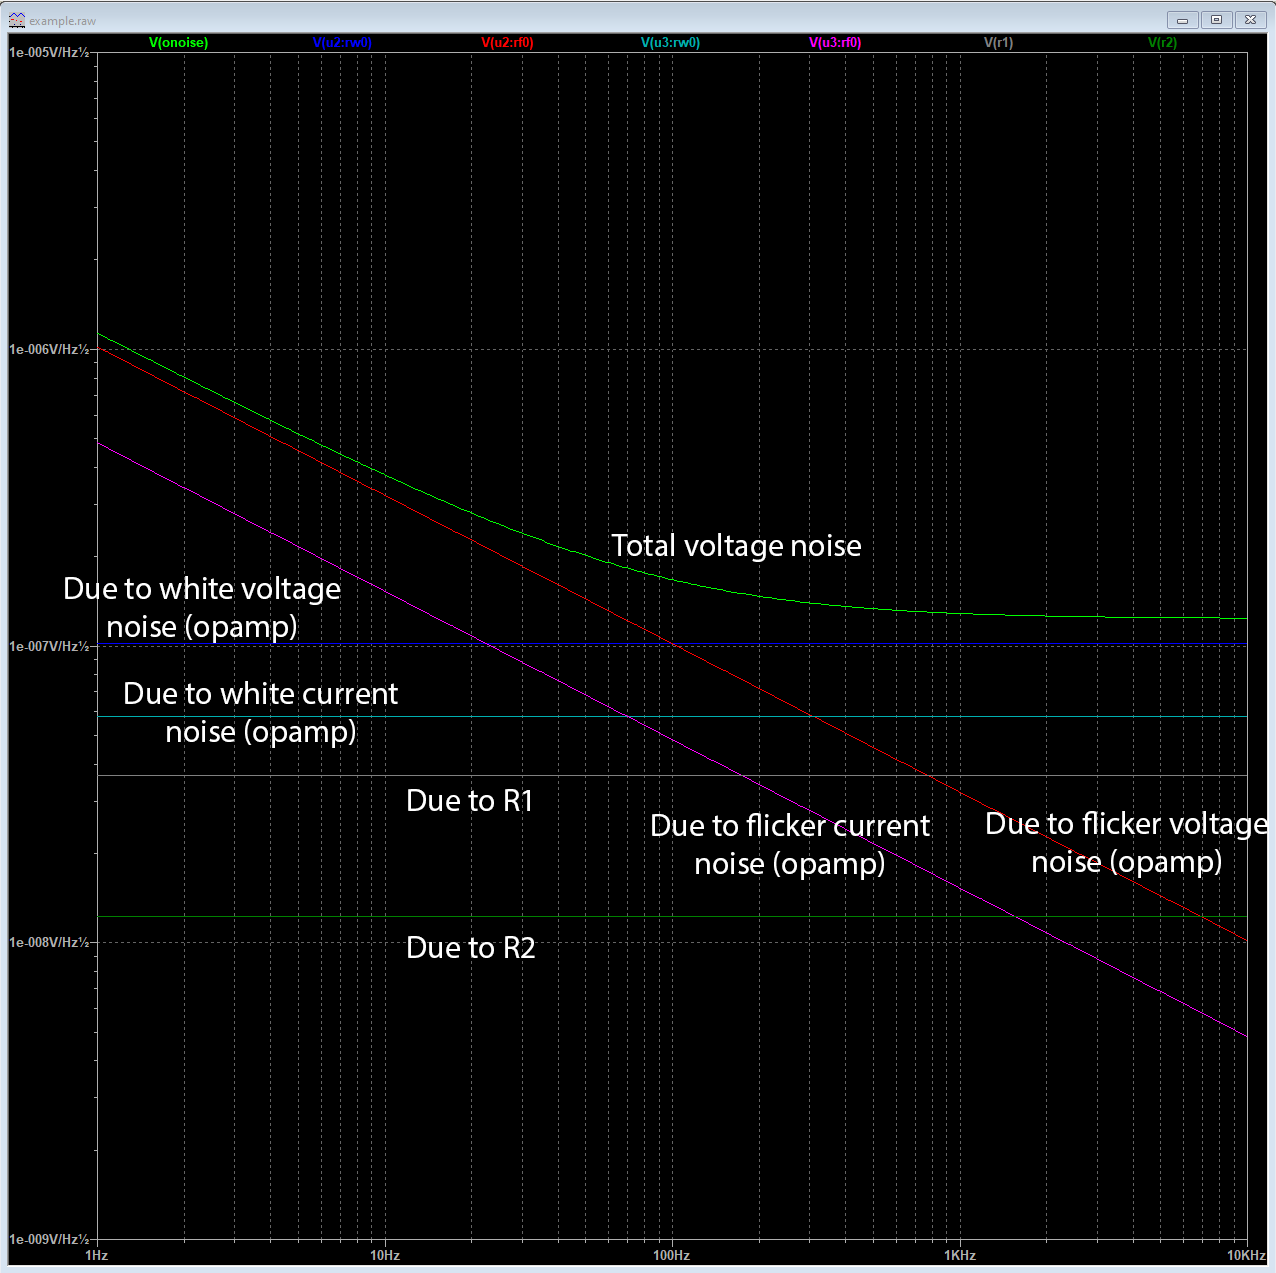
  1. Simulate your circuit. When displaying the results (right mouse click in the plot -> Add Traces), the following naming convention must be considered:
  • rw0 corresponds to the white noise source
  • rf0 corresponds to the flicker noise source

6

As this result shows, the contributions of the individual noise sources to the total noise can be quantified in this way. 5

\$\endgroup\$
4
  • \$\begingroup\$ Do you have to edit opamp.sub to add the noiseless flag to the R3 inside or is it too small to make a difference? \$\endgroup\$
    – Ste Kulov
    Commented Aug 24, 2022 at 20:35
  • \$\begingroup\$ Without the subcircuit nodes, is it still possible to click and plot the contributions of U2 and U3 as compound noise (i.e. flicker + white) ? \$\endgroup\$
    – tobalt
    Commented Aug 25, 2022 at 6:08
  • \$\begingroup\$ @Ste Kulov: Good point, if you want to make sure that there is no additional noise contribution by R3 it is better to add the noiseless flag. However, I just checked this noise and it has a value of 1.2874687 fV/sqrt(Hz). Thus, the result does not change noticeably in practice. \$\endgroup\$
    – Charly
    Commented Aug 25, 2022 at 16:16
  • \$\begingroup\$ @tobalt: Unfortunately no, at least I haven't figured out how to display the noise by clicking on the opamp or the noise source yet. It seems to me that LTspice users don't have all the possibilities when creating their own symbols/subcircuits compared to the possibilities Analog Devices has (you can click on the manufacturer's opamps from the library). \$\endgroup\$
    – Charly
    Commented Aug 25, 2022 at 16:18

Your Answer

By clicking “Post Your Answer”, you agree to our terms of service and acknowledge you have read our privacy policy.

Not the answer you're looking for? Browse other questions tagged or ask your own question.