0
\$\begingroup\$

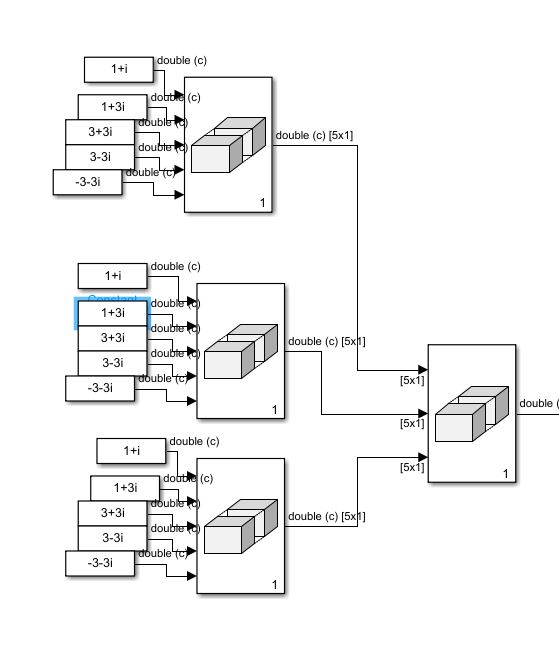
I'm trying to understand OFDM modulation using Matlab Simulink and I've built the following system

OFDM TX

I sent to the input of the OFDM block a frame of 15 samples that comes from the 16-QAM modulator. The OFDM modulator also receives a frame of 15 pilot symbols that I have chosen (see below)

PILOT

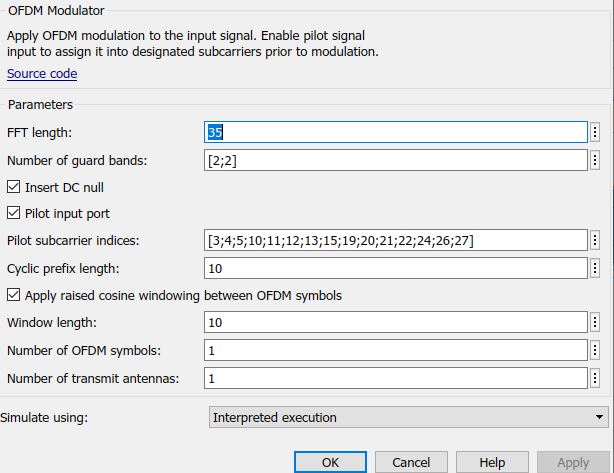
Now, My OFDM block has the following settings:

OFDM settings

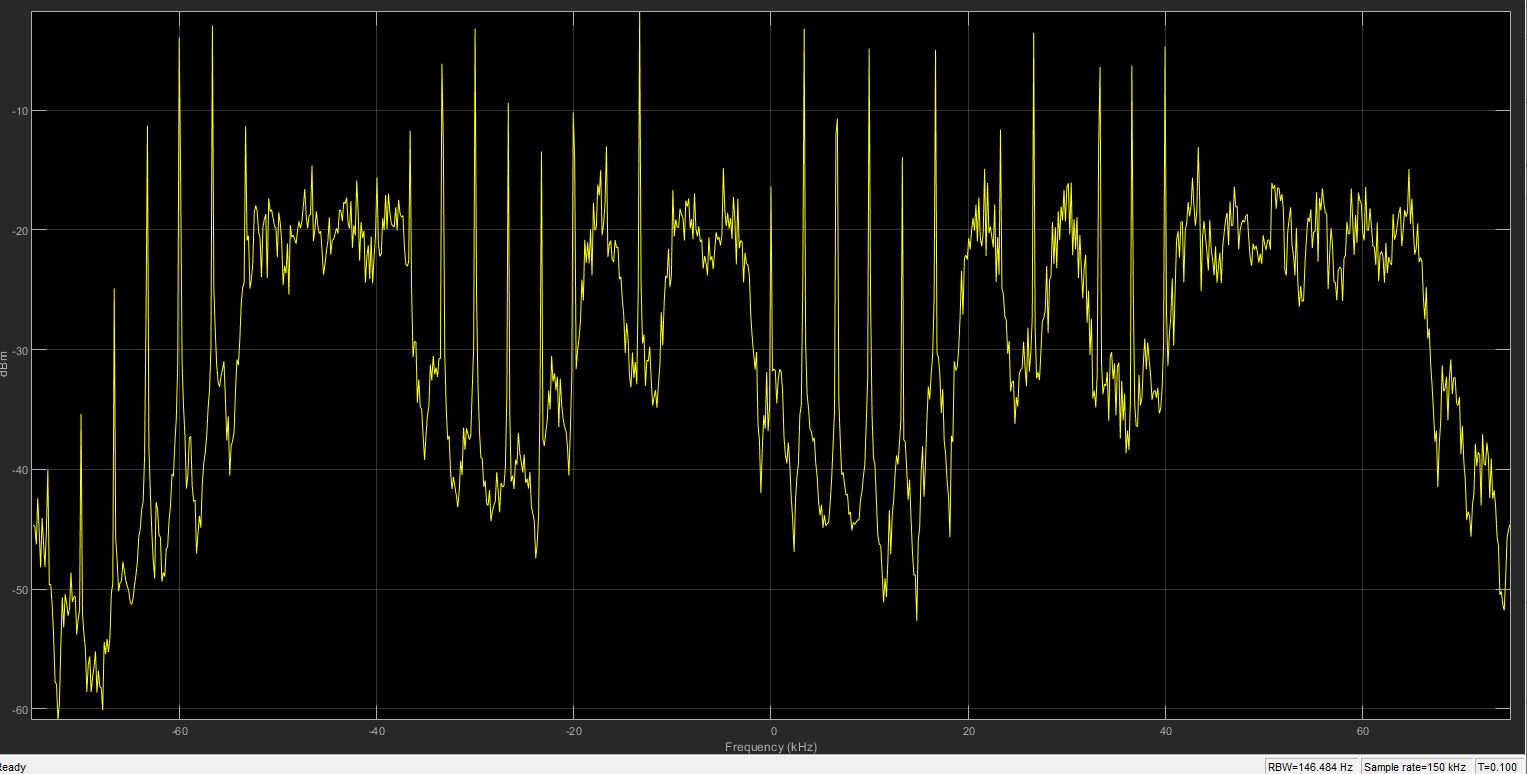
My question is, why the frequency spectrum of the output signal of the OFDM block has huge spikes?

freq

I have supposed to be the short FFT length compared to the number of pilot subcarriers but, I'm not sure about that

Thanks

\$\endgroup\$
4
  • \$\begingroup\$ hm, what are your pilot symbols? And the spectrum you show, how much did you average to get that spectrum? How white is your data? \$\endgroup\$ Commented Jun 11, 2021 at 14:37
  • \$\begingroup\$ @MarcusMüller pilot symbols are shown in the 2nd image. About the spectrum, I just used the Spectrum Analyzer of Simulink (it uses 1 Ohm as reference load) \$\endgroup\$
    – NicoCaldo
    Commented Jun 11, 2021 at 14:51
  • \$\begingroup\$ ah, I thought that was just a snapshot of a single realization of the pilots; Hm. Could you give us an overall overview of the full graph from sources to spectrum analyzer, not just the excerpt? \$\endgroup\$ Commented Jun 11, 2021 at 16:02
  • \$\begingroup\$ @MarcusMüller the spectrum analyzer is connected directly at the last buffer on the right \$\endgroup\$
    – NicoCaldo
    Commented Jun 12, 2021 at 6:42

1 Answer 1

1
\$\begingroup\$

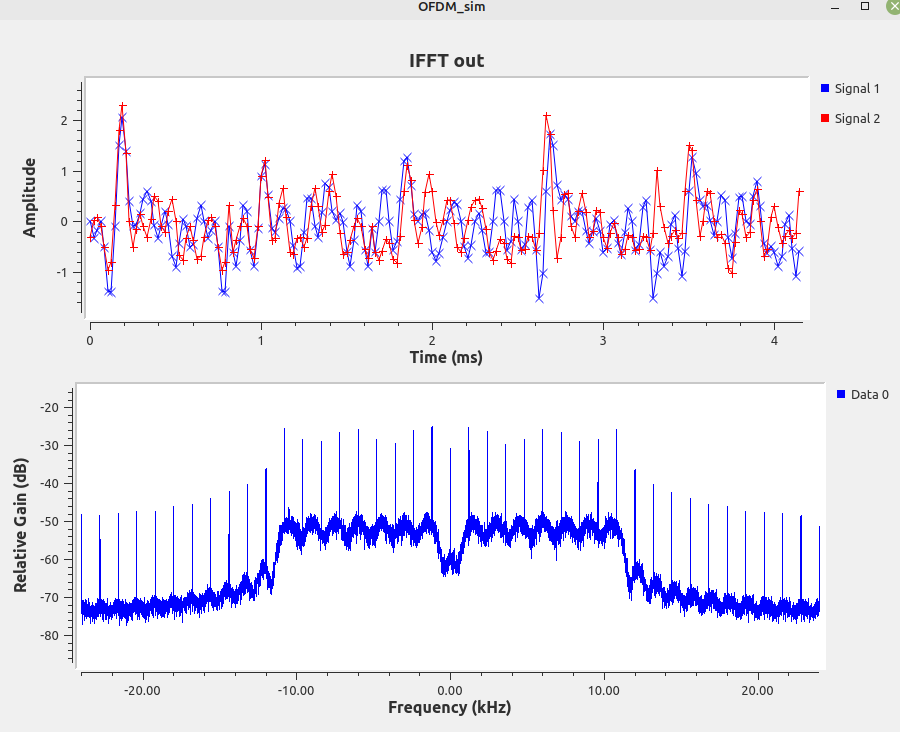
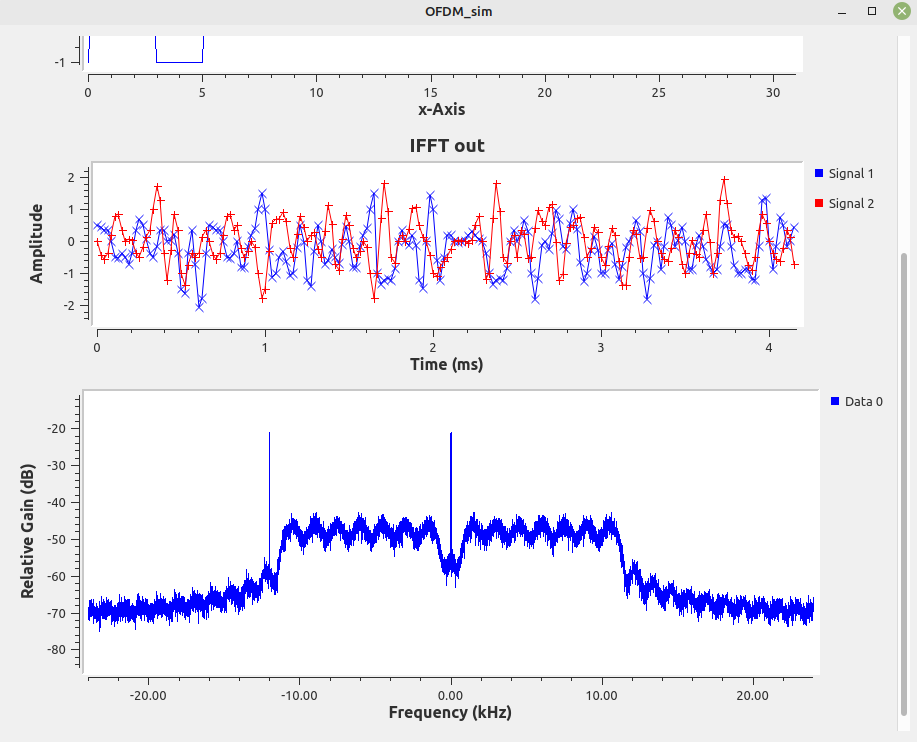
I believe you will find that the spikes occur at multiples of your symbol rate. eg: if symbols have length 1ms, then you will have spikes every 1kHz in the Freq domain. By symbol length I mean when the symbol has a disontinuity, abrupt change , between symbols. This is expected from sampling theory. I also see it in GNURadio. I had the same problem bc I was inputting incorrect complex values into the IFFT.I was inputting +1 & 0 as input data. This created much more discontinuities than necc and hence spikes. Once I realised this I corrected it. What you are doing with the IFFT is creating a series of BPSK or QPSK signals and adding them all together. if you input complex data into et IFFT, then you are actually entering 2 bits at a time, as 2 bits represent 4 possible phases , hence QPSK. But you also need to enter the data as a bipolar value eg +1 & -1. So you input complex values must be a pair of +1 & -1 values, a complex pair. Also, you must ensure all your unused components frequencies are set to 0, by entering 0 in those positions of your data. This is what I did to get the non spiky output. enter image description here

enter image description here

\$\endgroup\$

Your Answer

By clicking “Post Your Answer”, you agree to our terms of service and acknowledge you have read our privacy policy.

Not the answer you're looking for? Browse other questions tagged or ask your own question.