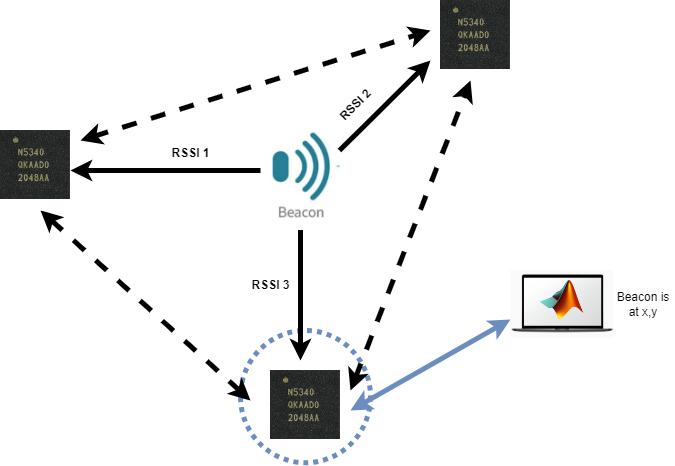
I am a total beginner in working with RTOS and Zephyr and nRF devices. I would like to build a Wireless Sensor Network which consists of 3 nodes (maybe set in a Bluetooth Mesh) whose primary objective is to measure the RSSI values from each of them to a moving beacon and transmit the values to a computer running MATLAB. The computer running the MATLAB program should, then, indicate the position (in x and y coordinates) on a real-time updated map of the moving beacon.
I have successfully flashed the "nrf_dm" example on two boards and have visualised the RSSI value of one in respect to the other in the VSCode Terminal. Also, I have flashed the "peripheral_hr" example on another board and have successfully plotted the value of the "heartrate" in a real-time updated figure in MATLAB.
So I have several questions:
- Is this possible?
If yes,
- Which examples can I further look into in order to achieve this?
The application is destined for indoor asset tracking and even though the accuracy of RSSI trilateration is around 1m I will be trying to improve it by Kalman Filtering in MATLAB.
