1
\$\begingroup\$

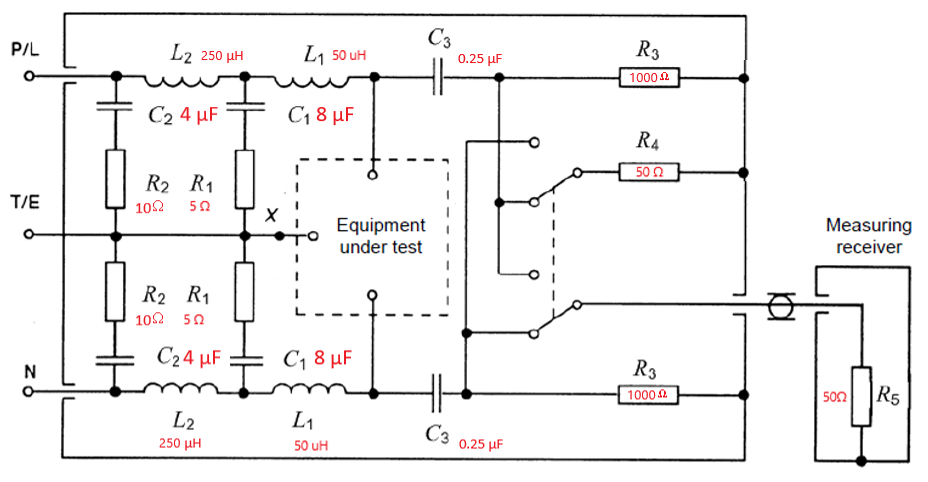
50 uH LISN Diagram
Figure 1: 50 uH LISN Diagram

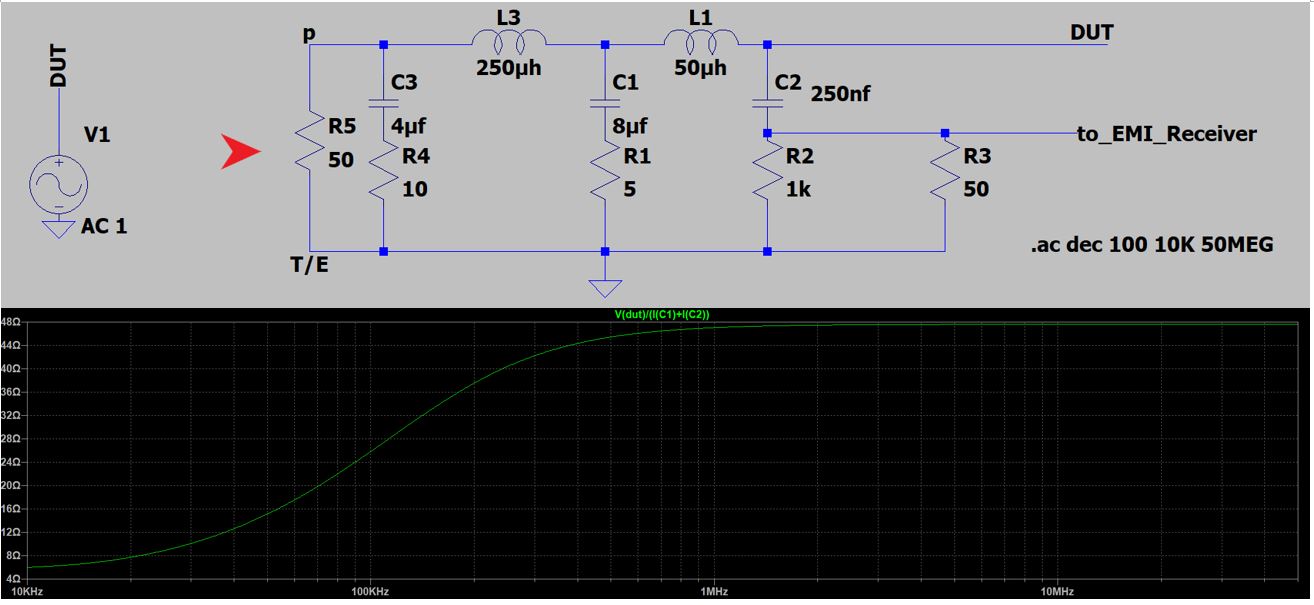
Input impedance of the LISN varies with frequency from 5Ω at 9 kHz to 50Ω at 30 MHz
Figure 2: Input impedance of the LISN varies with frequency from 5Ω at 9 kHz to 50Ω at 30 MHz

In Page 27 of Calibration and use of artificial mains networks and absorbed clamps from EMC Standards, author Tim Williams, it says:

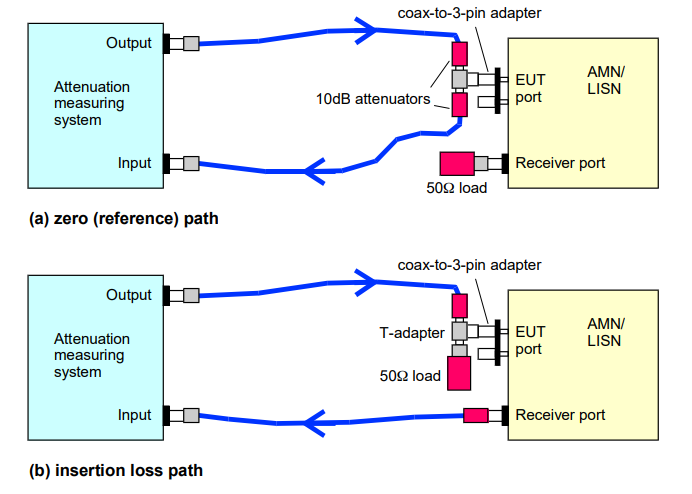
... The insertion loss of LISN is measured as a voltage ratio between the EUT port and the receiver port for all lines. It is normal practice to use a 50Ω system for the measurement, but as the input impedance of the AMN/LISN varies with frequency from 5Ω at 9 kHz to 50Ω at 30 MHz, driving the EUT port from a 50Ω source would give an input voltage that changes with frequency. The correct way to make the measurement is to feed the AMN/LISN and measuring system in parallel through a Tee adaptor, providing effectively a zero source impedance. The receiver port is terminated with a 50Ω load and readings taken on the attenuation measuring system over the required frequency range. The measurement system is then transferred to the receiver port and the 50Ω load transferred to the Tee adaptor. The insertion loss of the AMN/LISN is the difference between these two measurements.

My questions are

  1. Why I called “the wrong way” get a different insertion loss from ANSI or CISPR “correct way”?
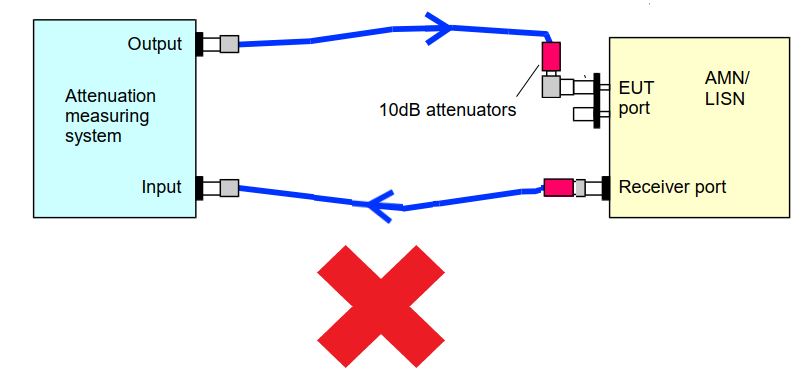
the wrong way to calibrate the LISN insertion loss
Figure 3: the wrong way to calibrate the LISN insertion loss

  1. How can the so called correct way can create a “zero source impedance”, by 2 times measurement and parallel through AMN/LISN and measuring system? Can you make a drawing to explain it?

the correct way to calibrate LISN insertion loss
Figure 4: the correct way to calibrate LISN insertion loss

\$\endgroup\$
5
  • \$\begingroup\$ Please clarify your specific problem or provide additional details to highlight exactly what you need. As it's currently written, it's hard to tell exactly what you're asking. \$\endgroup\$
    – Community Bot
    Commented Oct 4, 2023 at 13:08
  • \$\begingroup\$ Lv Yaojia - Hi, (a) I've added your images inline, to make the question easier for readers to visualise. I used your HTML hidden "alt text" as figure titles, where possible. I believe my work is correct, but please check. (b) Are any of those images copied/adapted from elsewhere? If so, then for you to comply with the site rule on referencing, we need you to add a suitable reference for each image copied or adapted from elsewhere. If the source material is online, then the reference can be the website name and a link to the source webpage (see the rule for books etc.). TY \$\endgroup\$
    – SamGibson
    Commented Oct 4, 2023 at 23:57
  • \$\begingroup\$ The images were drawn by myself \$\endgroup\$
    – Lv Yaojia
    Commented Oct 5, 2023 at 5:37
  • \$\begingroup\$ @LvYaojia - Hi, Re: "The images were drawn by myself" That does not match our review. Those images seem to be copied or adapted from elsewhere, not originally drawn by you. (a) Figure 4 in the question is copied from Figure 25 in the pdf file you linked. Therefore your claim that it was drawn by yourself seems to be wrong. (b) Figure 3 is clearly adapted from the same figure in the pdf file. Since the original drawing was not yours, it must be correctly referenced too. \$\endgroup\$
    – SamGibson
    Commented Oct 5, 2023 at 18:10
  • \$\begingroup\$ (continued) (c) Figure 1 is adapted from an international standards document. Again, even if you adapted it, that was not originally drawn by you and therefore the source needs to be referenced. || Therefore, as I explained before, in order for you to comply with that site rule, it is your responsibility to add the correct reference next to each image, for its source (e.g. website name & webpage / pdf link if it's from an online source, or a full citation for books, papers or other sources where you cannot give a link). Thanks. \$\endgroup\$
    – SamGibson
    Commented Oct 5, 2023 at 18:10

1 Answer 1

1
\$\begingroup\$

They're taking the ratio of measurements, so that the result is always in ratio to, or normalized again, the input-side voltage. Which is equivalent to having a constant voltage at the input, without having to wire up some impossibly powerful and wideband amplifier.

Doing a once-through measurement assuming the input voltage is constant, is erroneous, because as you know from the simulation, the input impedance and therefore input voltage is not constant.

This measurement can also be done in a single pass, with a pair of 10x probes and a dual-channel oscilloscope for example, but the standards aren't written assuming any particular kind of test equipment, and the most likely means one would have on hand are 50Ω sources and receivers.

You can measure the voltage gain in simulation by setting the source to 50Ω ESR, and viewing V(to_EMI_Receiver)/V(DUT). Note that R3 represents the EMI receiver as such, so a further connection "to" a receiver is kind of weird to be hanging off to the right. But in the sense that schematic placement doesn't have any strict semantic meaning, only the netlist, that's excusable.

(No relation, by the way. :) )

\$\endgroup\$
2
  • \$\begingroup\$ Thank you for the explicit explanation! And the hanging off to the right of R3 should be deleted. \$\endgroup\$
    – Lv Yaojia
    Commented Oct 5, 2023 at 4:37
  • \$\begingroup\$ I repost a question in below link, can you help answer again? electronics.stackexchange.com/questions/683975/… \$\endgroup\$
    – Lv Yaojia
    Commented Oct 5, 2023 at 6:07

Your Answer

By clicking “Post Your Answer”, you agree to our terms of service and acknowledge you have read our privacy policy.

Not the answer you're looking for? Browse other questions tagged or ask your own question.