Question
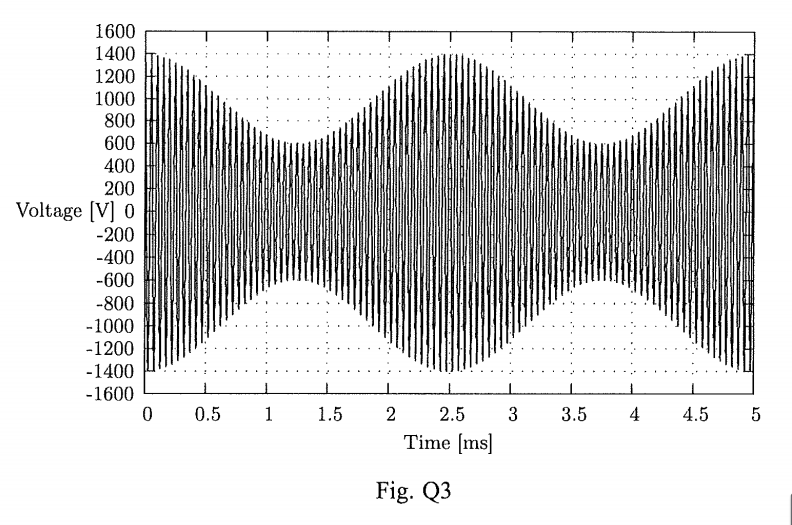
The voltage waveform measured at the 50ohm antenna terminal of a 11750-kHz AM (DSB-LC) short-wave broadcasting transmitter is shown in Fig. Q3.

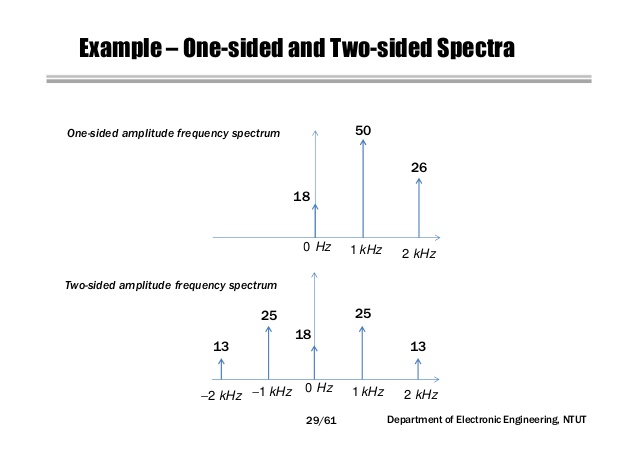
How to draw the one-sided magnitude spectrum of the transmitted signal in dBW?
My Work
Now we know that \$f_c = 11759*10^3\$Hz and \$f_m = \frac{1}{T} = \frac{1}{0.0025} = 400\$Hz.
For Signal,
\$V_{m(rms)}=400/\sqrt{2}=200\sqrt{2}\$V
\$P_m=V^2/R=(200\sqrt{2})^2/50=1600\$W
\$P_{m(dBW)}=10\log(1600)=32.04\$dBW
For Carrier,
\$V_{c(rms)}=1000/\sqrt{2}=500\sqrt{2}\$V
\$P_m=V^2/R=(1000\sqrt{2})^2/50=10000\$W
\$P_{c(dBW)}=10\log(10000)=40\$dBW
a. I wonder that : The modulation index should be only 0.4. The ratio \$V_{c(rms)}\$ over \$P_{c(dBW)}\$ is too high. My calculation should be wrong?
b. The term "One-sided Magnitude Spectrum" means that I only have to draw either USB or LSB?
Thank you for your help.

