\$\begingroup\$
\$\endgroup\$
2
-
2\$\begingroup\$ Where did you get stuck solving this for your homework? \$\endgroup\$– Andy akaCommented Mar 30, 2020 at 7:25
-
\$\begingroup\$ Thanks for asking! :) I was not able to figure out how to express power spectrum in terms of the autocorrelation of the sequence. I was able to solve it after that \$\endgroup\$– Shirish SrivastavaCommented Apr 2, 2020 at 19:57
Add a comment
|
1 Answer
\$\begingroup\$
\$\endgroup\$
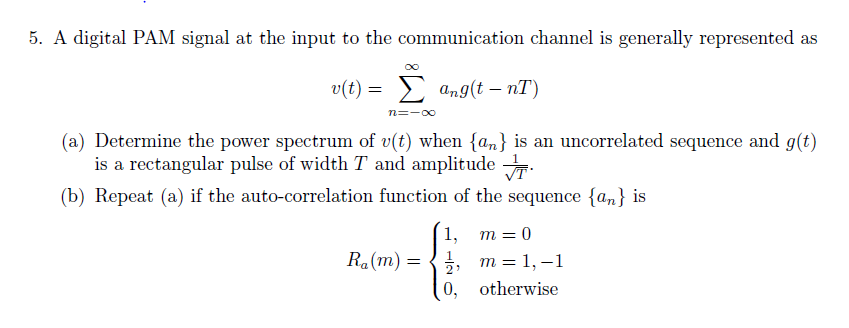
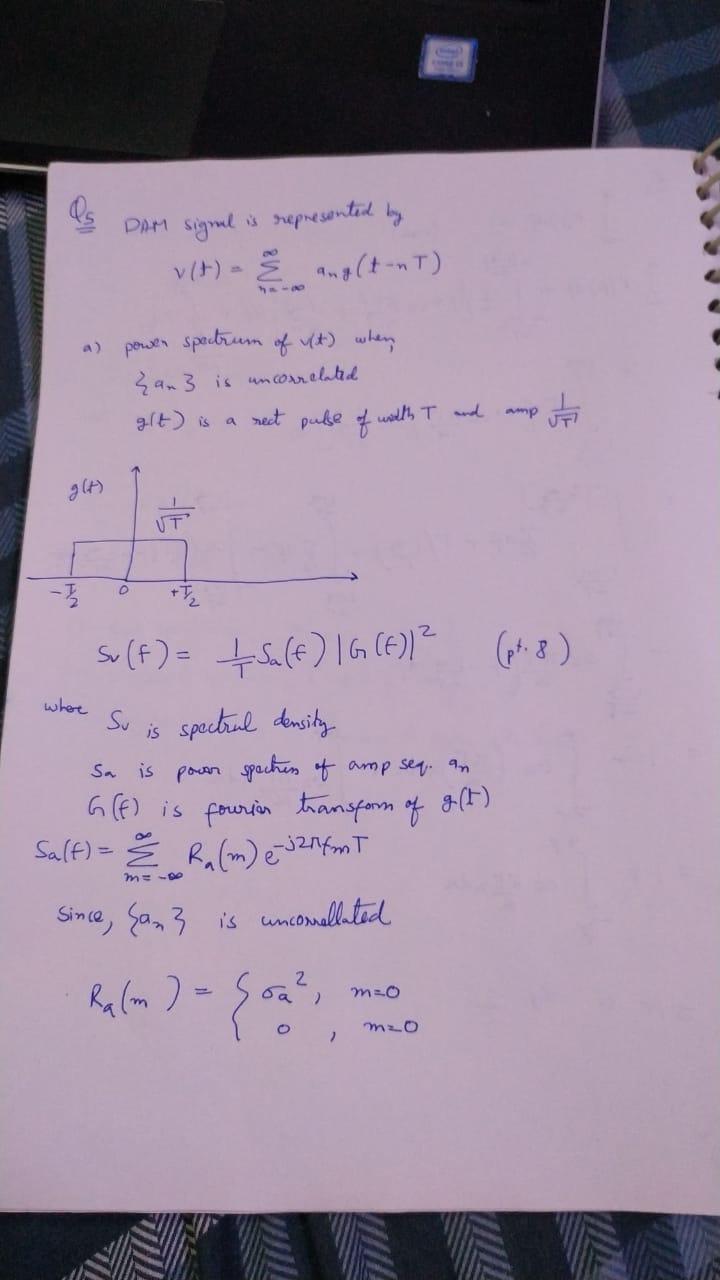
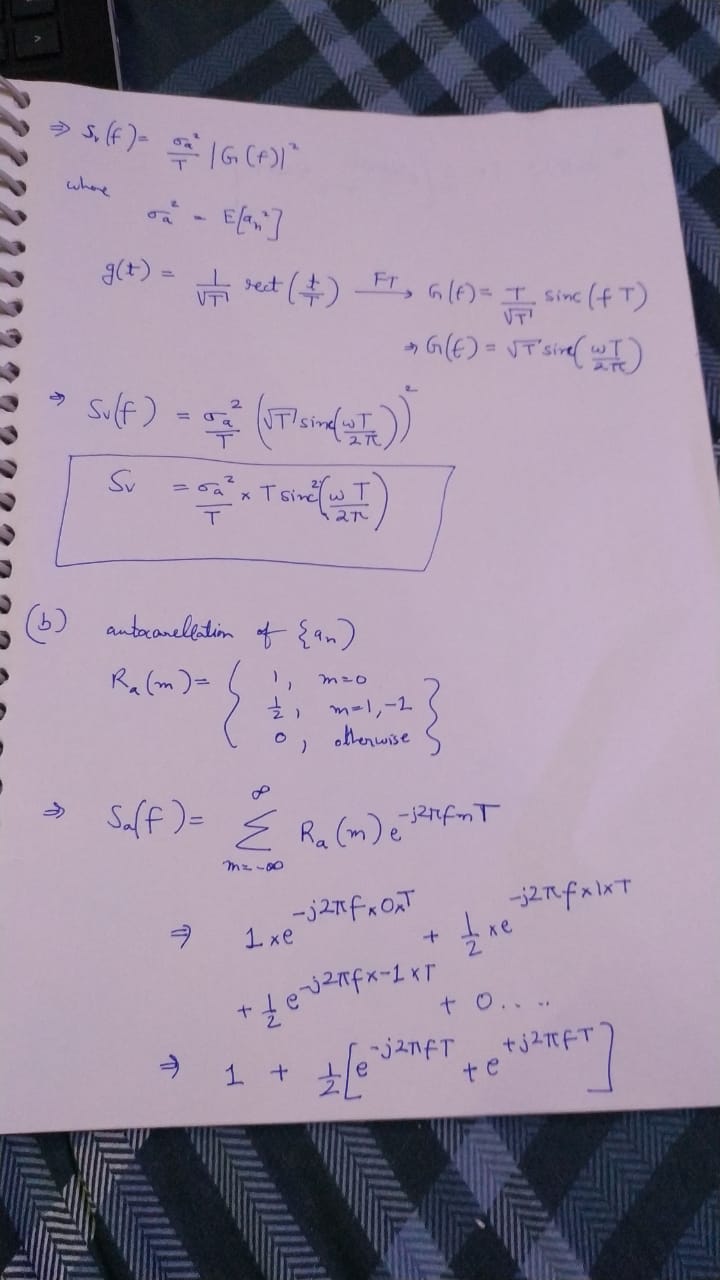
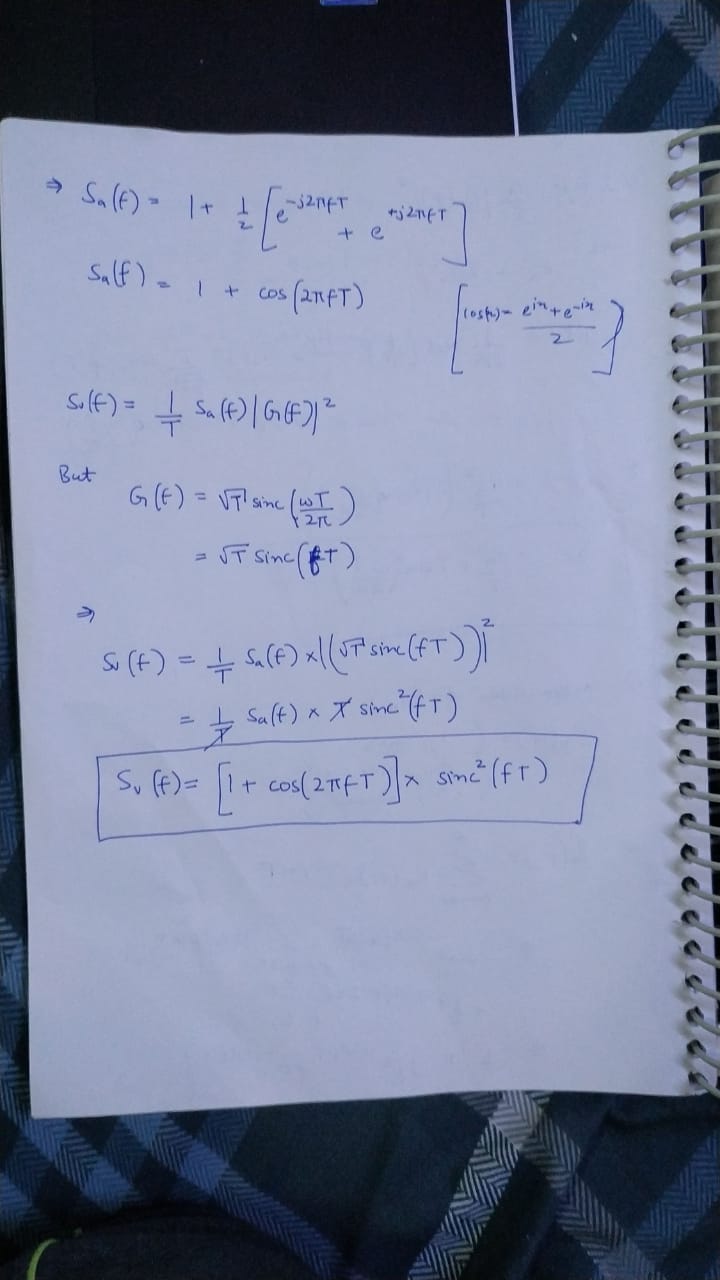
the power spectrum can be represented using the autocorrelation of the a_n sequence and the fourier transform of the g(t) pulse. using the given formula in the image. question solved.


