4
\$\begingroup\$

Question

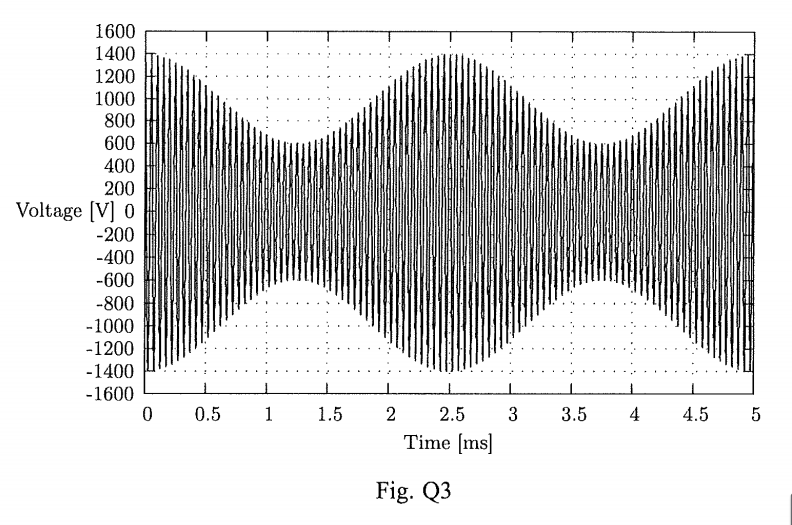
The voltage waveform measured at the 50ohm antenna terminal of a 11750-kHz AM (DSB-LC) short-wave broadcasting transmitter is shown in Fig. Q3.
enter image description here

How to draw the one-sided magnitude spectrum of the transmitted signal in dBW?

My Work

Now we know that \$f_c = 11759*10^3\$Hz and \$f_m = \frac{1}{T} = \frac{1}{0.0025} = 400\$Hz.

For Signal,

\$V_{m(rms)}=400/\sqrt{2}=200\sqrt{2}\$V

\$P_m=V^2/R=(200\sqrt{2})^2/50=1600\$W

\$P_{m(dBW)}=10\log(1600)=32.04\$dBW

For Carrier,

\$V_{c(rms)}=1000/\sqrt{2}=500\sqrt{2}\$V

\$P_m=V^2/R=(1000\sqrt{2})^2/50=10000\$W

\$P_{c(dBW)}=10\log(10000)=40\$dBW


a. I wonder that : The modulation index should be only 0.4. The ratio \$V_{c(rms)}\$ over \$P_{c(dBW)}\$ is too high. My calculation should be wrong?

b. The term "One-sided Magnitude Spectrum" means that I only have to draw either USB or LSB?


Thank you for your help.

\$\endgroup\$

2 Answers 2

1
\$\begingroup\$

Think about it, your either drawing something in the frequency domain or the time domain. You have time time domain, how do you get to the frequency domain? The answer is: the Fourier transform.

A carrier has one frequency, a side band has frequency in two places. Since these are symmetrical around the carrier sometimes its advantageous to see only one side.

Since you have not described if you signal is sampled or not it will make a difference on how it is plotted. However, either way a sine wave is just a dirac delta function after you take the Fourier transform

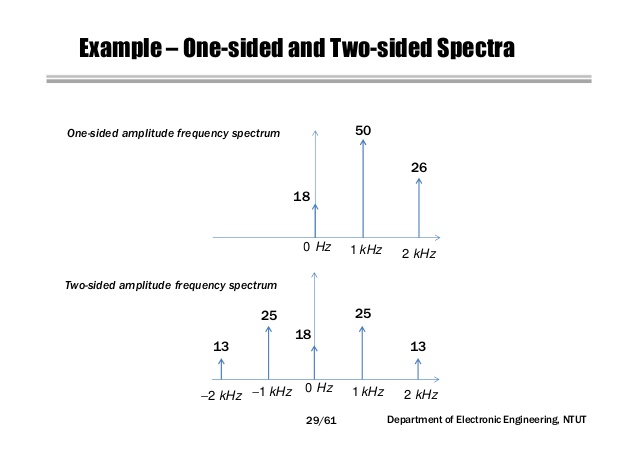
So if you graphed the total power, you would have the amplitude of the carrier with the two side bands x distance away from the carrier with the amplitude of the sine wave being the height of the dirac funuctions of the side bands. enter image description here

Note1

Note2

\$\endgroup\$
1
\$\begingroup\$

Laptop is correct. The Fourier transform of the carrier (which will be a Dirac for a cosine carrier) will appear at the carrier frequency, and the modulating signal (which also appears to be a cosine) spectra will appear above and below the carrier. These message signals will be a distance equal to the message frequency away from the carrier in the center. This is true for a large carrier modulation scheme of phi(t)_am = (A_c + m(t)) cos(w_c*t).

To answer your other questions:

A. The modulation index can be found by inspection. It looks like your amplitude is modulating by about 800 pk to pk. The carrier has a pk to pk of 2000. Therefore the modulation index is 800/2000. An index of .4 for AM is really really efficient.

B. They probably mean that you only need to draw the spectra on the positive frequency axis since the magnitude spectrum is symmetrical. Not the USB or LSB. That's for SSB modulation.

\$\endgroup\$

Your Answer

By clicking “Post Your Answer”, you agree to our terms of service and acknowledge you have read our privacy policy.

Not the answer you're looking for? Browse other questions tagged or ask your own question.