1
\$\begingroup\$

I'm trying to extract two characteristics: "Input Offset Voltage" and "Open Loop Gain" of an opamp LM741 by using LTspice. To do that, I use the following circuit model and plots where the horizontal variable is the input voltage Vin between -2mV to +2mV: enter image description here
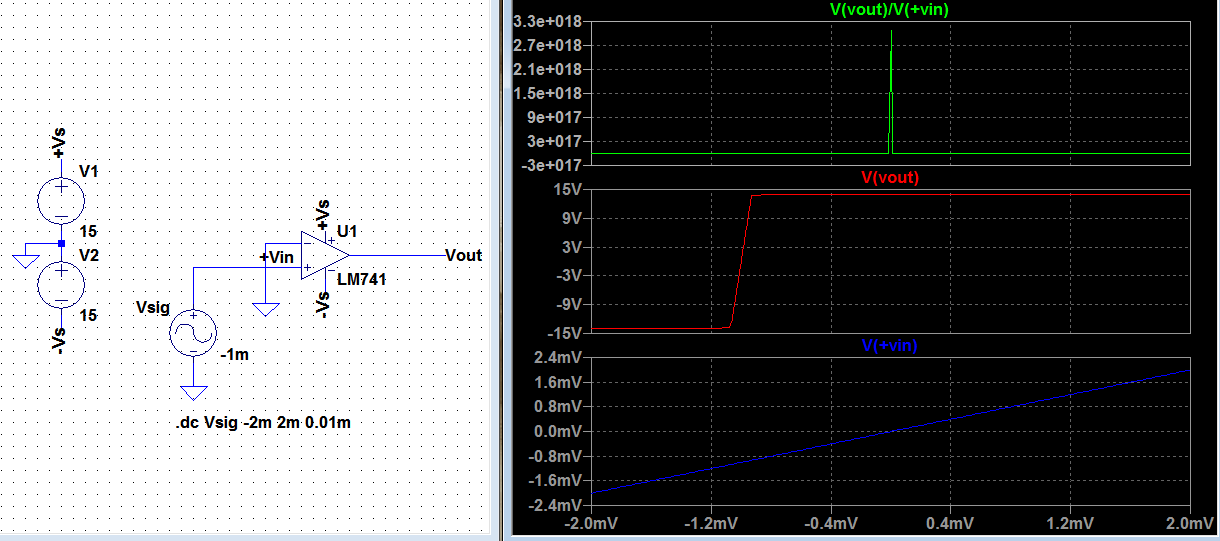
To see the Input Offset Voltage I check the value of the Vin when Vout is zero in the middle red plot. This is roughly around -0.99998mV. So I conclude this is the Input Offset Voltage.

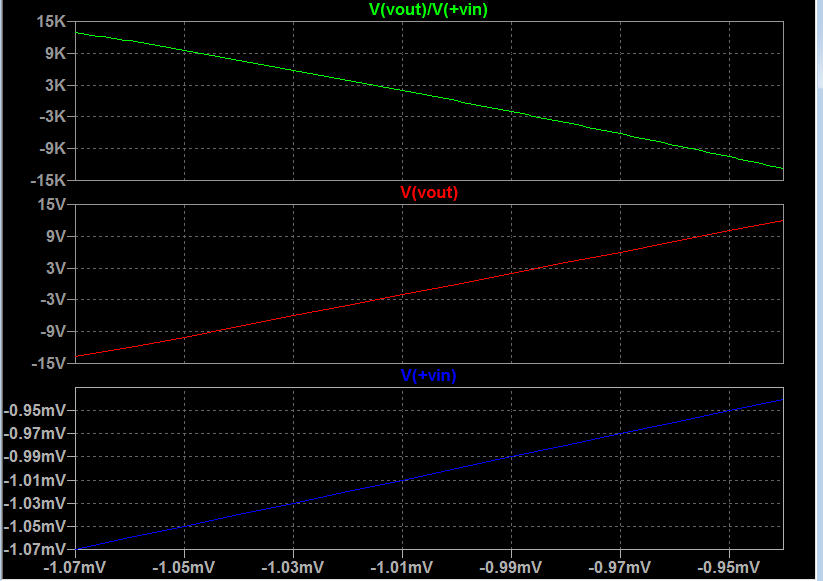
As you see in the top plot, the gain which is Vout/Vin changes(from zero to a crazy big number) dramatically. Isn't that supposed to be a constant huge number? (edit: Okay this is because of division by zero). But gain is changing in linear region as well see the second plot below.

But how can the "Open Loop Gain" be determined in a similar way? Should the "Input Offset Voltage" be used when finding this as well?

Here is only focusing on linear/amplifying region and the gain is still dramatically dependent on the input voltage:

enter image description here

Why is the gain not constant? I was expecting a huge almost constant number as the open loop gain.

\$\endgroup\$
4
  • 2
    \$\begingroup\$ Why not opening the datasheet? \$\endgroup\$
    – user76844
    Commented Apr 7, 2017 at 10:05
  • \$\begingroup\$ I did that wasnt the question \$\endgroup\$
    – user16307
    Commented Apr 7, 2017 at 10:24
  • \$\begingroup\$ Why not looking at the SPICE model parameters? \$\endgroup\$ Commented Apr 7, 2017 at 18:51
  • \$\begingroup\$ I wanted to plot the gain \$\endgroup\$
    – user16307
    Commented Apr 7, 2017 at 18:56

2 Answers 2

4
\$\begingroup\$

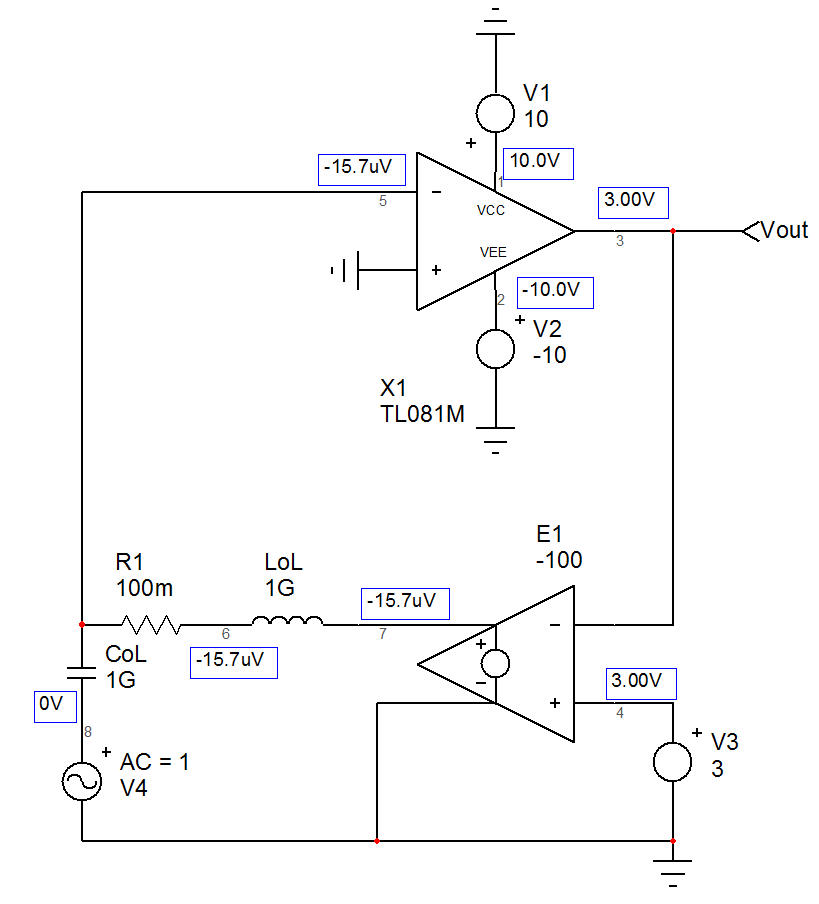
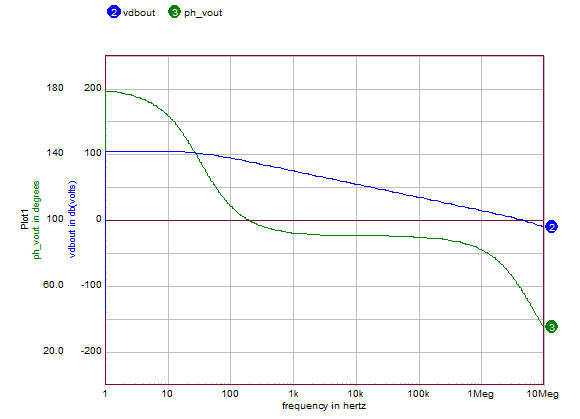
When trying to determine the open-loop gain of an op amp in SPICE, the issue is how to bias it in a true linear open-loop configuration so that it does not rail-up or down to \$V_{CC}\$ or \$V_{EE}\$? You can try to adjust the bias voltage µV by µV but it is really tedious. The circuit below will get you there quite quickly. Assume you want to check the OL of the TL081. Bias it with the right supplies and add a source \$E_1\$ as in the schematic. This source sees the TL081 output and will force it to deliver an arbitrarily-selected 3-V value. When SPICE starts the analysis, it shorts all inductors and opens all caps. LoL is shorted while CoL is removed. Source \$E_1\$ fine-tunes its output to bias the TL081 which delivers 3 V as expected. Then, once the bias point is determined, SPICE can ac-sweep the circuit and you obtain the nice Bode plot as below (blue is the magnitude in dB while the green is the phase). The circuit was simulated in IsSpice but will also work in LTSpice or in any other simulators.

enter image description here

enter image description here

\$\endgroup\$
0
\$\begingroup\$

I think I found the reason why. It was because the equation should actually be:

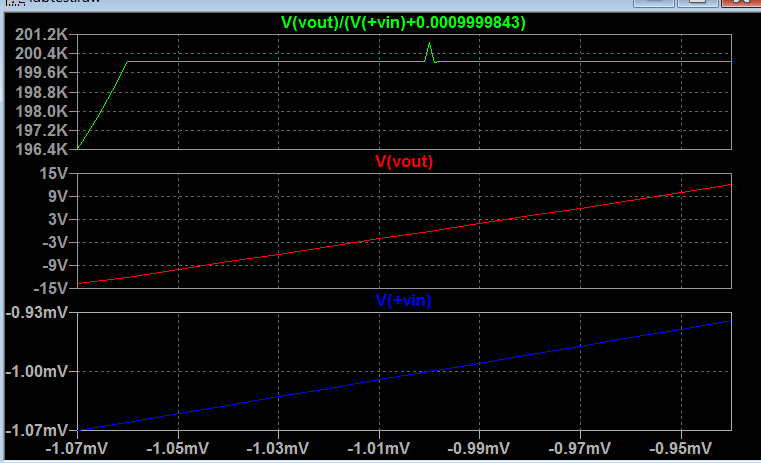
V(vout)/(V(+vin)+0.0009999843)

Where the input offset voltage is -0.0009999843V. This should be subtracted from the Vin and plot becomes better around with a gain of 200K: enter image description here

\$\endgroup\$
1
  • \$\begingroup\$ The problem was the input offset voltage. I thought the amplifier amplifies vin with a gain A as vout(t)=A*vin(t) where vin is the signal applied by the signal generator(not the exact voltage difference the amplifier sees); but actually what happens is vout(t)=A*[vin(t)+v_input_offset]. And if I plot plot(vin, vout./vin) I get a nonlinear nonsense plot but if I plot this as plot(vin, vout./(vin+v_input_offset) the linearity of the gain can be seen. I didnt take into account the input offset voltage when trying to simulate the gain. \$\endgroup\$
    – user16307
    Commented Apr 7, 2017 at 12:58

Your Answer

By clicking “Post Your Answer”, you agree to our terms of service and acknowledge you have read our privacy policy.

Not the answer you're looking for? Browse other questions tagged or ask your own question.