0
\$\begingroup\$

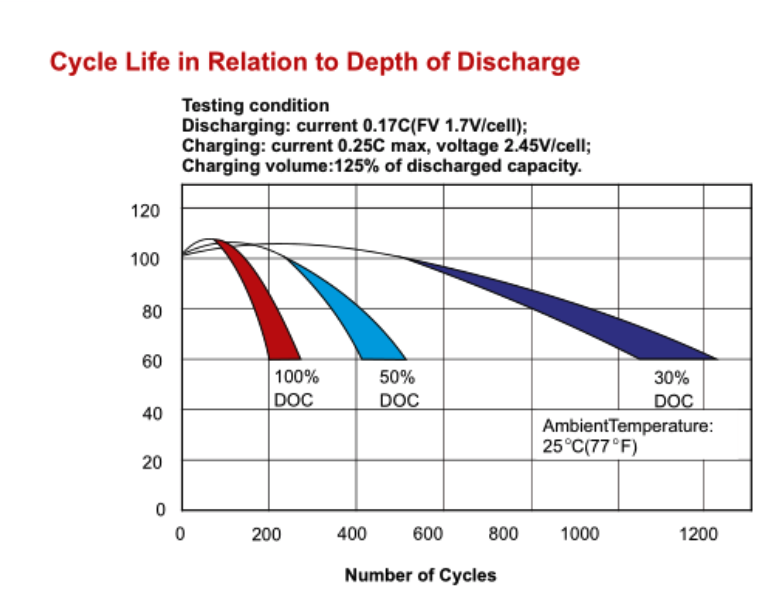
I'm trying to understand the spec of a SLA battery. There's a chart which is titled "Cycle Life in Relation to Depth of Discharge":

enter image description here

Can I ask what 'DOC' stands for and the chart is read? How come that line exceeds 100 on the left axis? I presume the left axis represents the percentage of discharge.

\$\endgroup\$
4
  • 3
    \$\begingroup\$ it probably exceeds 100% because the marketing intern who made it thought the arc looked cool \$\endgroup\$
    – vicatcu
    Commented Feb 24, 2019 at 15:20
  • 1
    \$\begingroup\$ It seems that DOC = Depth Of Discharge \$\endgroup\$
    – G36
    Commented Feb 24, 2019 at 15:23
  • \$\begingroup\$ @G36 Right. But what about the left axis? \$\endgroup\$
    – John M.
    Commented Feb 24, 2019 at 15:36
  • 1
    \$\begingroup\$ The left axis is the percentage of discharge. And more than 100% maybe means that the battery was charged above the normal amp-hours capacity. \$\endgroup\$
    – G36
    Commented Feb 24, 2019 at 16:37

1 Answer 1

0
\$\begingroup\$

DOC looks like an erroneous contraction of DOD and SOC ...
DoD = Depth of Discharge
SoC = State of Charge

SoC is equal to 100% when the DoD is 0%, and 0% when the DoD is 100%

Regarding exceeding the 100%:

It is sometimes possible for a battery DoD to exceed 100%, if the nominal energy capacity was estimated conservatively, or because of actual operating conditions different from the nominal operating conditions. Source

(the latter already suggested by @G36).

\$\endgroup\$

Your Answer

By clicking “Post Your Answer”, you agree to our terms of service and acknowledge you have read our privacy policy.

Not the answer you're looking for? Browse other questions tagged or ask your own question.