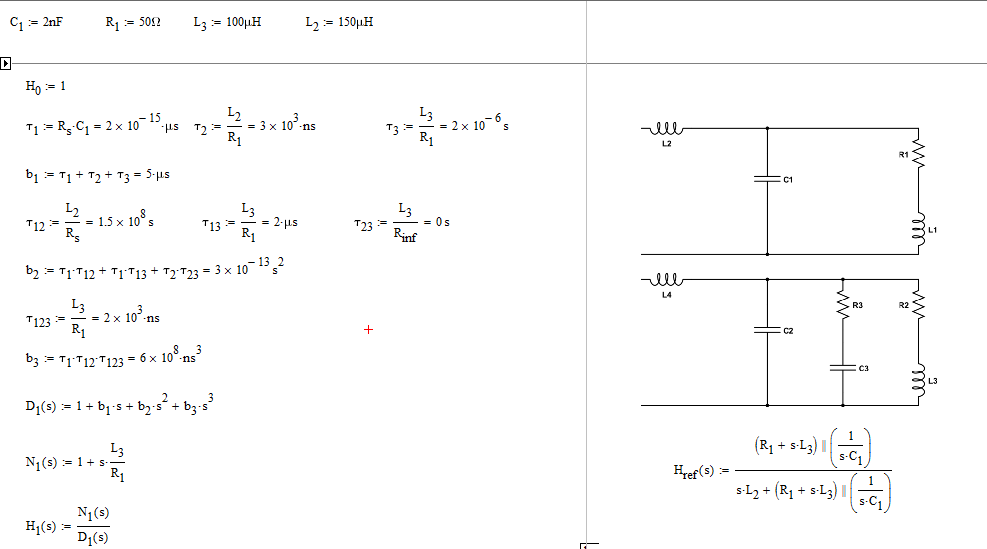
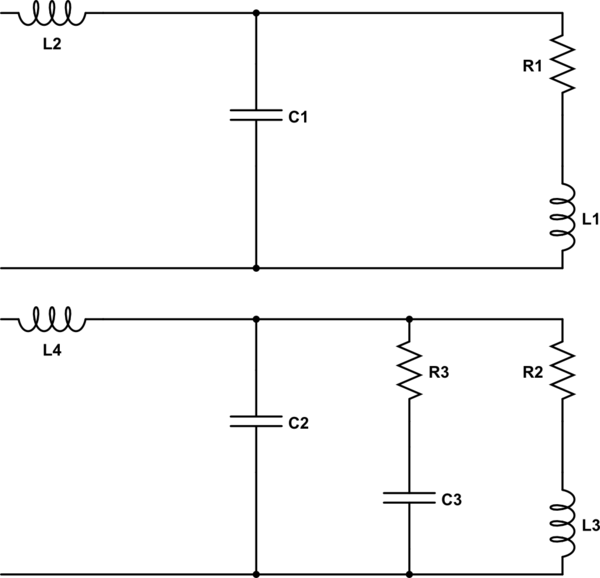
To determine the transfer functions of the two circuits, you can apply the fast analytical circuits techniques or FACTs. Basically, you turn the excitation off and "look" at the energy-storing element's terminals to determine what resistance \$R\$ they offer. Then, combine \$R\$ with the involved \$L\$ or \$C\$ to form time constants. Finally, you assemble the time constants to form the denominator and numerator.
In the first example, I assumed the excitation is a voltage source and you observe the response across \$C_1\$. With the FACTs, I can already see a zero formed by \$L_3\$ and \$R_1\$. Immediately, you have \$N(s)=1+s\frac{L_3}{R_1}\$ (your \$L_1\$ is relabeled \$L_3\$ to have three distinct times constants).
If you do things right, you obtain the results shown in the below Mathcad sheet in which I have quickly factored a quality factor and a resonant frequency:

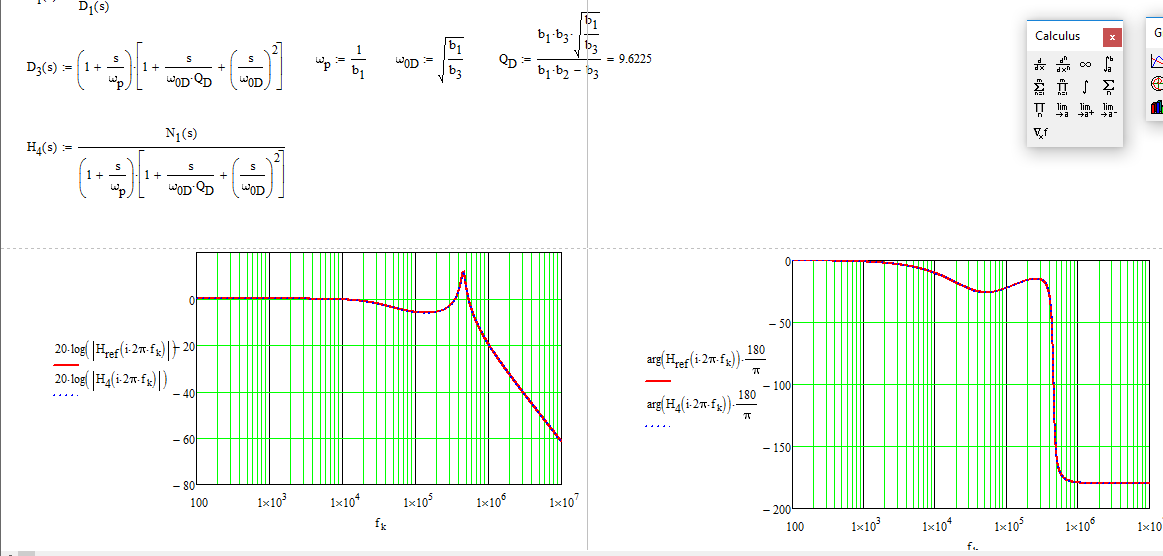
Finally, you can plot the reference transfer function and the one obtained with the FACTs, they perfectly agree:

The difficult part is to find the dominant pole and the double poles. You have to check on the time constants to see which dominate the response. An interesting presentation is available here, written by Prof. Bob Ericsson from CoPEC. Actually, writing the transfer function in a factored form is truly the basis of low-entropy formatting. Without this approach in which you can see a quality factor and a resonant frequency, there is no way you can select component values to meet design goals.


