There is this rule of thumb to estimate the required bandwidth of a digital signal by its rise time: $$ \text{f}_{\text{knee}} = \frac{0.5}{\text{t}_{rise}} $$
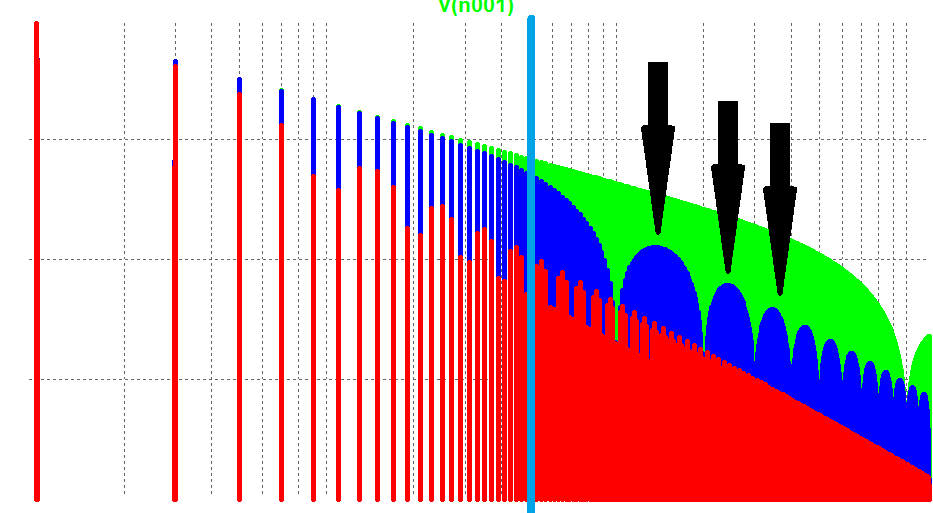
This knee frequency is described in "High Speed Digital Design: A Handbook of Black Magic" as the point at which the spectrum of a real signal would show a steep fall off. I simulated this, first with python and then LTspice, and expected that the spectrum would be monotonously decrease above the knee frequency. Both simulations of a 100 MHz square wave showed the following:
The green spectrum has the steepest rise time (10 ps), whilst blue has a lower (100 ps) and red the lowest (1000 ps). One can see that the spectrum of blue shows a steep fall off somewhere around the knee frequency (light blue shows knee frequency), but then rise again (black arrows). I tried different windows types and widths in LTspice. The overall shape remained the same.
Can this be explained mathematically or is this not part of the theory, but an artifact from the FFT?
LTspice circuit


