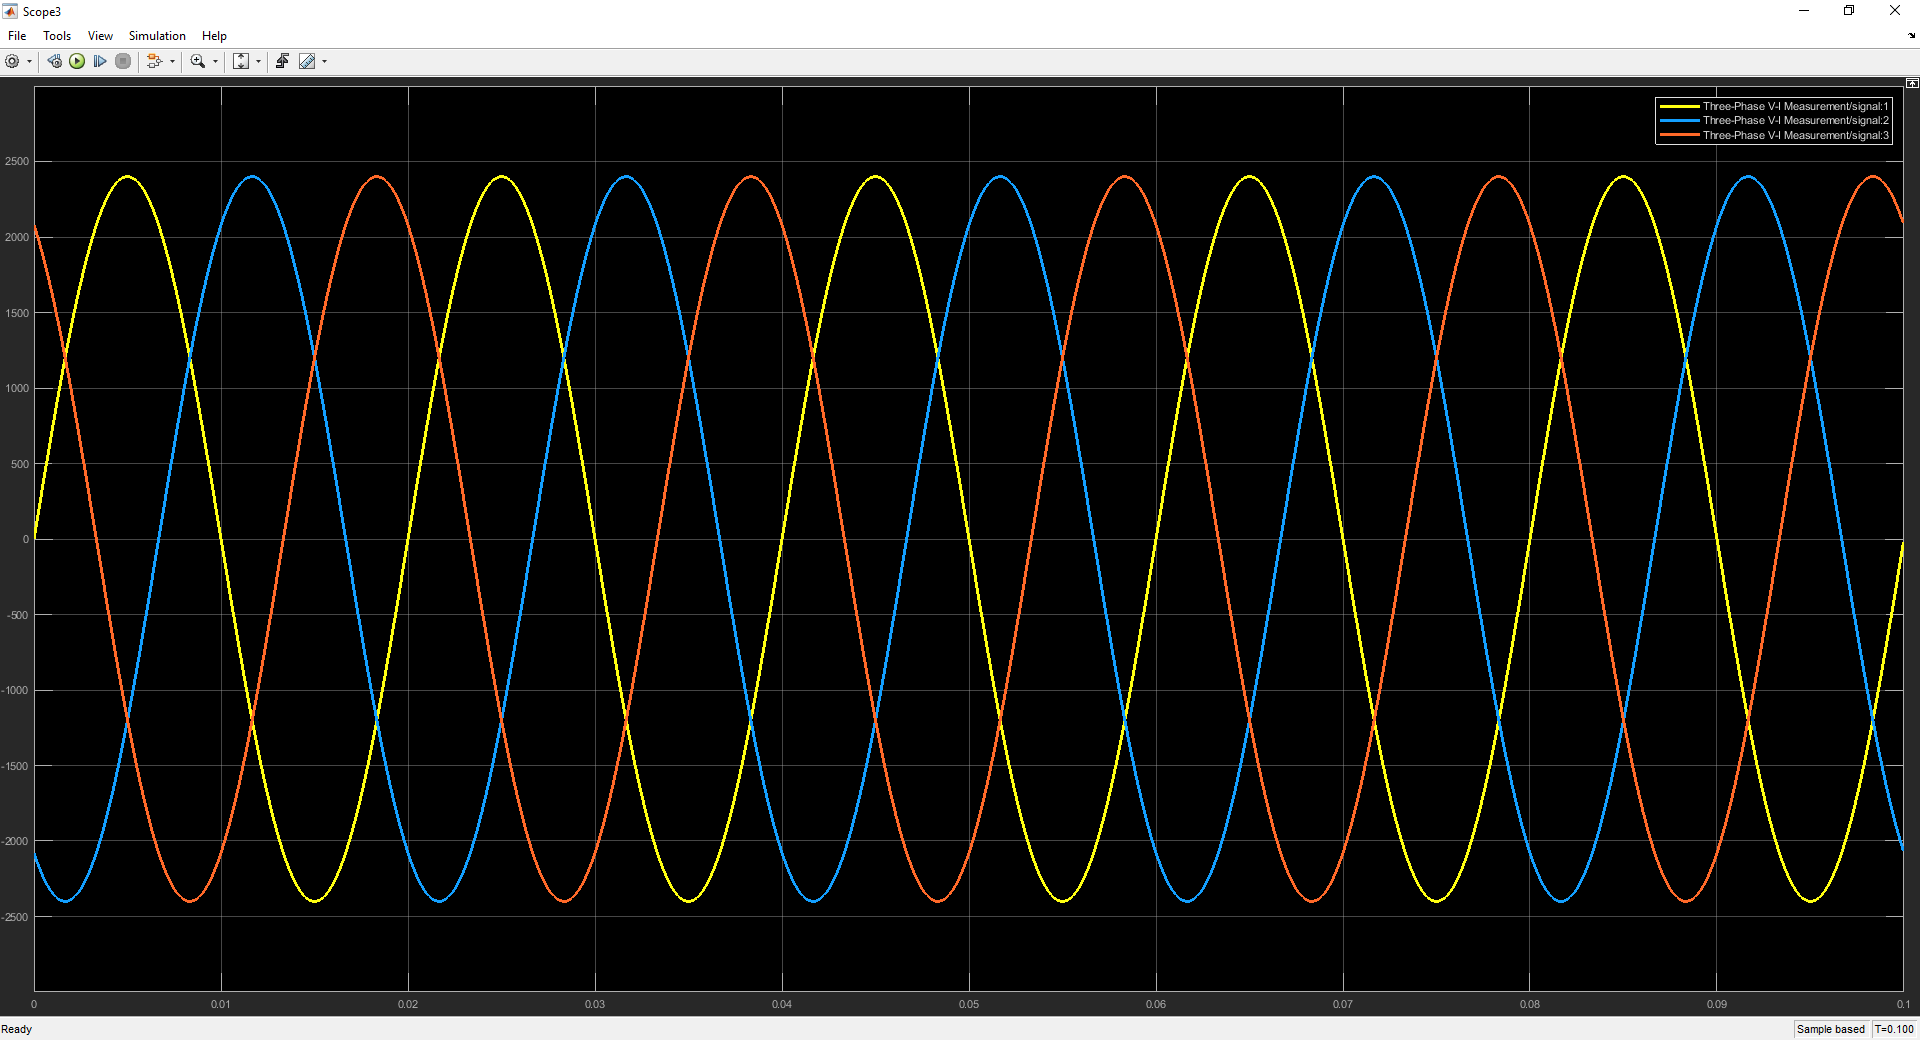
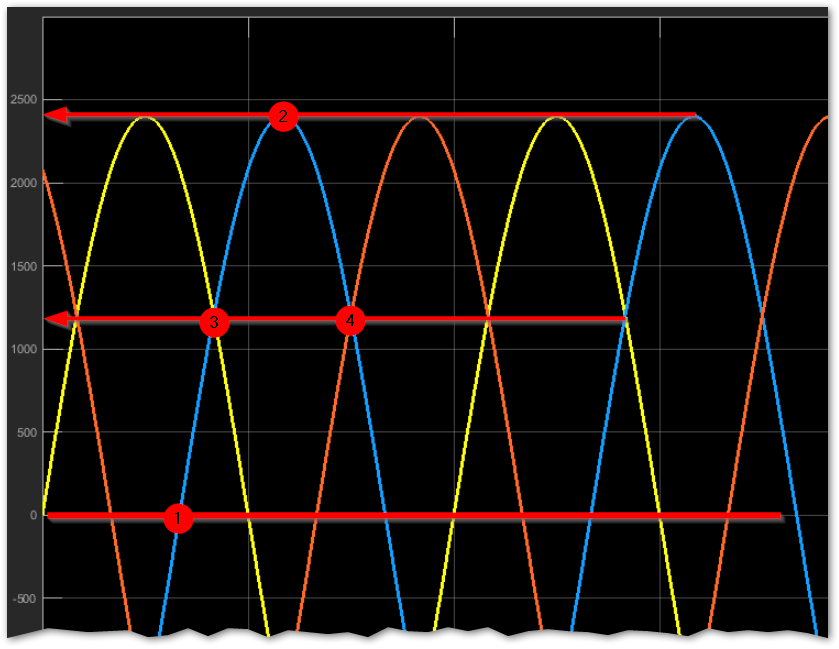
So i'm doing a matlab simulation of delta wye transformer and would need to show the phase shift between voltages. Here is a picture of input voltages so how would I show on this graph mathematically or graphically that these voltages are 120 degrees apart?
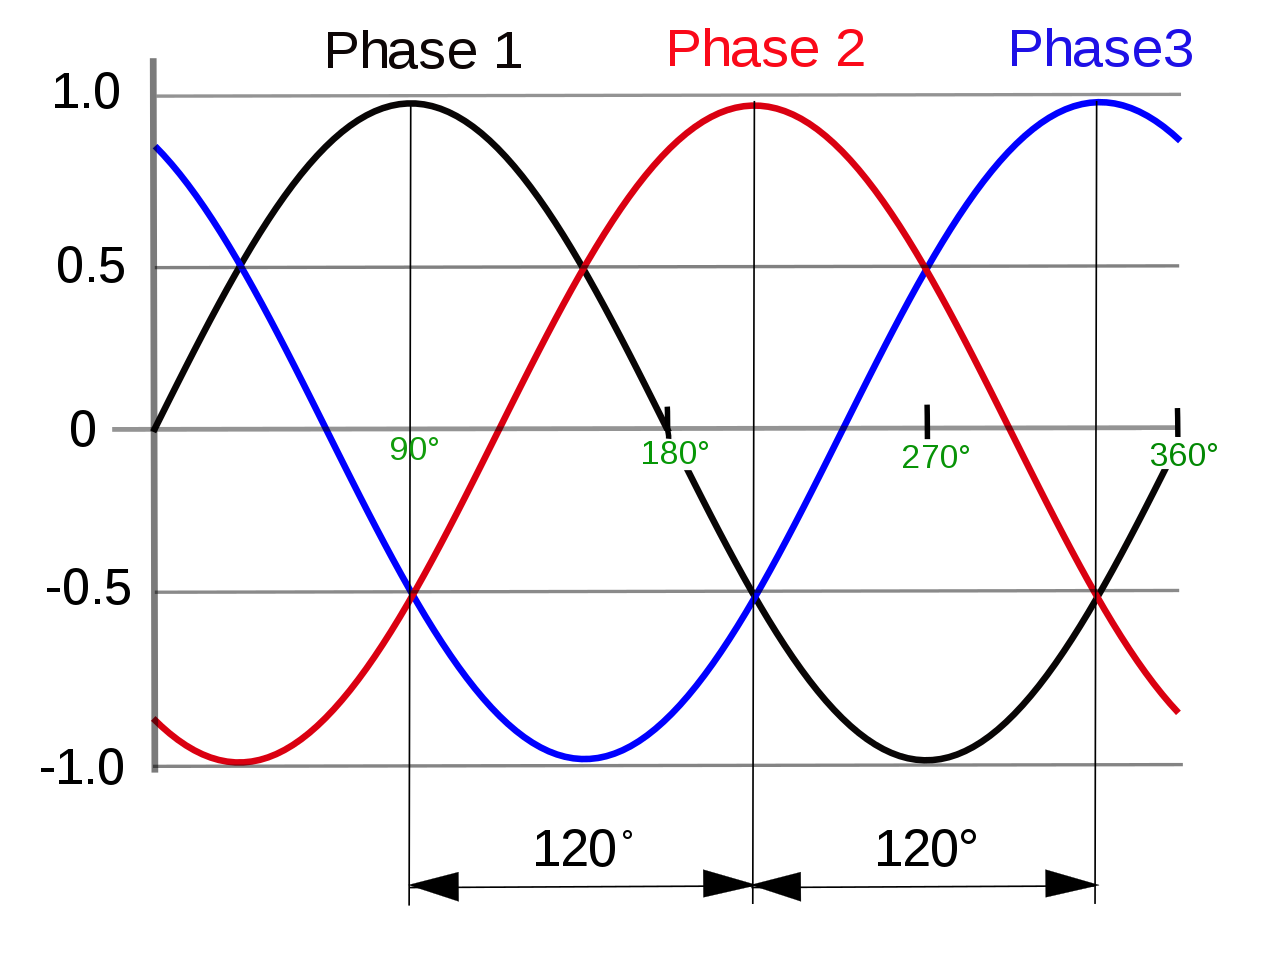
I tought of doing it like on this picture, to find degrees or radians and compare them, but on the graph from simulink above numbers are small so I don't know how.

