2
\$\begingroup\$

I have found in the following graphic the characteristic curve of a locomotive with six DC series wound electric motors at 3000V. As a translation: the y axis describes, on the left, the force in tf (metric tonne-force), and on the right speed in km/h. The x axis describes current in A. The first function from bottom describes the characteristic when the motors are connected between them in series. In the second function there are two branches in parallel of three motors each. In the third function there are three branches in parallel of two motors each. These functions correlate speed and current. The straight line correlates traction force and current. Note that in every case the current axis describes the current that flows through a single branch of motors in each combination. The dashed lines describe each case with a shunt field.

I was trying to come up with a function that for a given voltage, speed and motor combination gives current and traction effort. However I am not familiar with electric circuits and I have had no results.

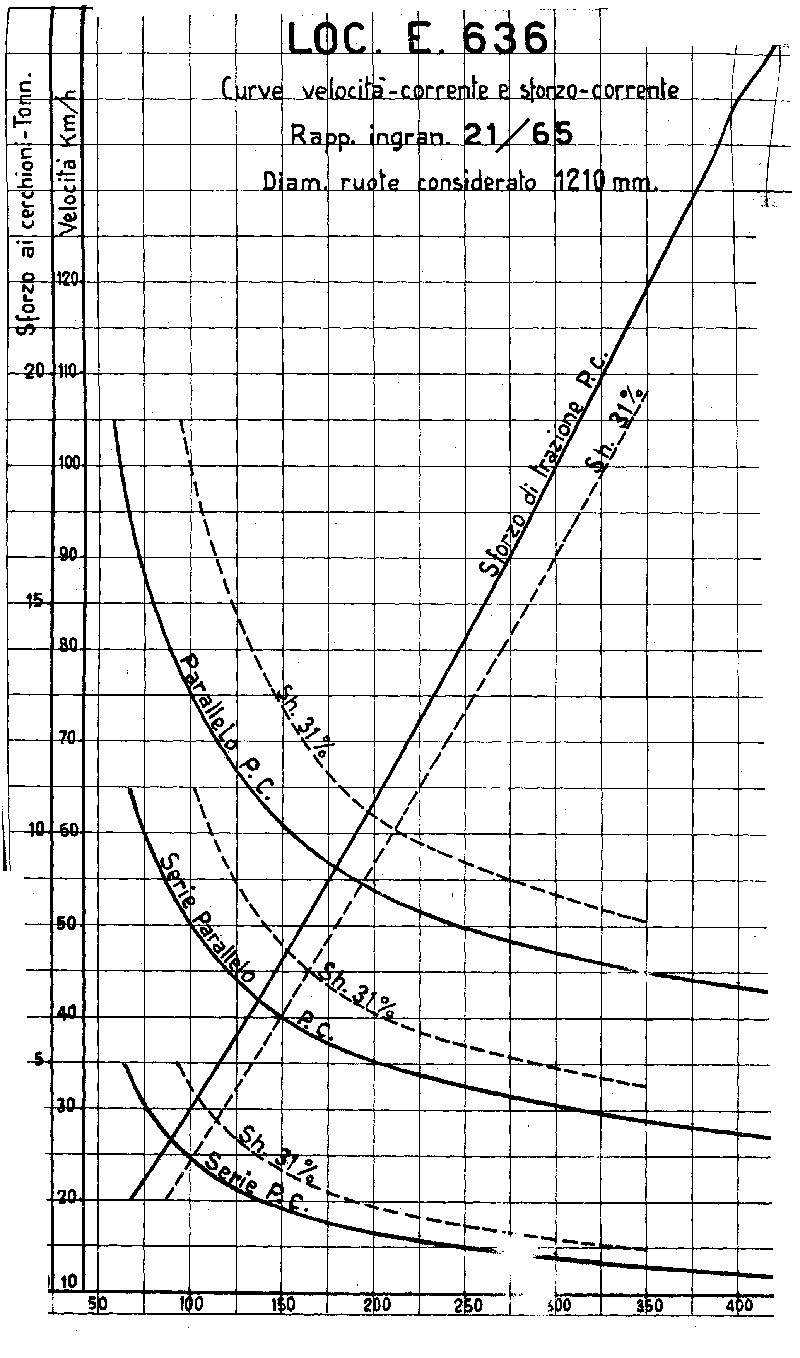
Thank you in advance. Characteristic curve

\$\endgroup\$
2
  • \$\begingroup\$ Series-wound motors are not something you come across every day : or very often at all, these days. The first thing to understand is how they differ from shunt-wound (and compound) motors. Out of curiosity, when was this graph published? \$\endgroup\$
    – user16324
    Commented Mar 8, 2016 at 17:45
  • 1
    \$\begingroup\$ The locomotive was designed between 1937 and 1940. The graph is of the same period. \$\endgroup\$
    – mghis
    Commented Mar 8, 2016 at 18:05

2 Answers 2

1
\$\begingroup\$

There are several factors that make it difficult to develop equations that give motor performance curves.

  1. Nonlinearity of the motor magnetization curve.
  2. Motor mechanical losses: windage and friction
  3. Drive train losses: gear, bearing & wheel friction
  4. Armature reaction effects.

The motor combinations determine the motor voltage. Six motors in series results in 500 volts applied to each motor, two groups of three in series results in 1000 volts, and three groups of two in series results in 1500 volts. You could consider the three curves to be current vs. speed curves for a single motor at 500, 1000 and 1500 volts.

If you want to draw traction force vs. speed curves, the most accurate results would probably be obtained by using the data from the existing curves.

Re Shape of Current vs Traction Force-Curve:

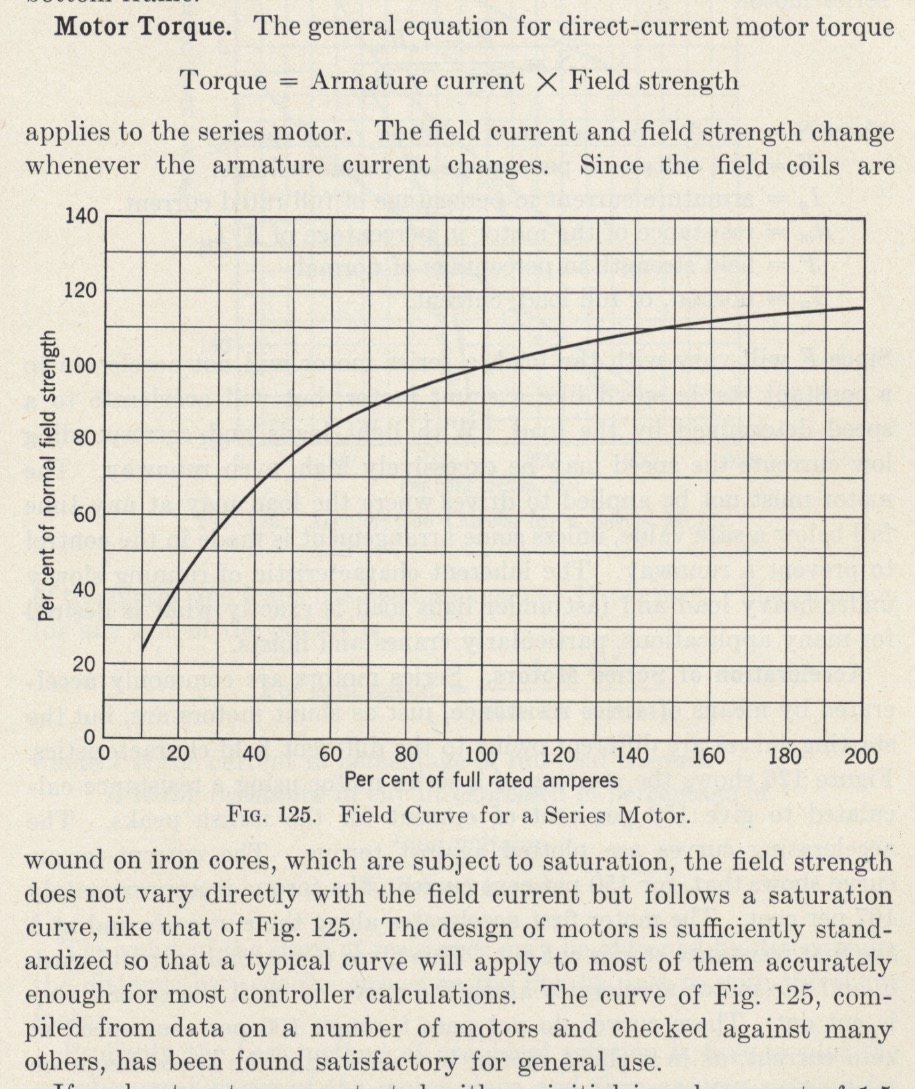
The part of the Current vs Traction-Force curve that is shown, appears of be fairly linear, but it actually curves upward somewhat showing the effect of the motor torque being proportional to the product of armature current and field strength, where the field strength is proportional to the armature current. If the curve were to be plotted to zero torque a much more quadratic curve would be seen. In addition, the effect of iron saturation works to flatten the curve at high current. I may have time to illustrate this later.

Here is an excerpt from P. B. Harwood "Control of Electric Motors" 1952

enter image description here

\$\endgroup\$
0
\$\begingroup\$

Well not clearly what the graph is rapresenting I can just do some comments. Each DC motor has two main coils that are right angled, these are armature and field. The field can be connected: shunt, series, or externaly constant current fed. The torque of the motor is M=kIaIf. From your graph can be deduced that it is about a DC motor with series wound field.

http://myelectrical.com/notes/entryid/153/dc-motor-operation

\$\endgroup\$
6
  • \$\begingroup\$ I tried to explain what the graph represents in the original question. I know that the six motors are series wound (I wrote that above). I need an equation which relates speed and voltage to current according to the graphic. \$\endgroup\$
    – mghis
    Commented Mar 8, 2016 at 21:07
  • \$\begingroup\$ From a mathematical point of view, the graphic is y = f(x), where y is speed and x is current. I need the function "f". \$\endgroup\$
    – mghis
    Commented Mar 8, 2016 at 21:13
  • \$\begingroup\$ You find it in every book of electric motors. vlab.ee.nus.edu.sg/~bmchen/courses/EG1108_DCmotors.pdf equation 17, 19 \$\endgroup\$ Commented Mar 8, 2016 at 21:20
  • \$\begingroup\$ I had indeed tried the equation I = (V)/(R+KS) (where I = current, V = tension, R = resistance, S = speed) but could not solve it to get results consistent with the graphic. Indeed the function is similar to the graphic but I cannot find values for R and K giving approximately the same results of the graph. \$\endgroup\$
    – mghis
    Commented Mar 8, 2016 at 22:00
  • \$\begingroup\$ @mghis The weird part is that torque is linear, but it shall be quadratic, perhaps some variable coupling in between motor and the wheel? \$\endgroup\$ Commented Mar 9, 2016 at 8:02

Your Answer

By clicking “Post Your Answer”, you agree to our terms of service and acknowledge you have read our privacy policy.

Not the answer you're looking for? Browse other questions tagged or ask your own question.