1
\$\begingroup\$

I tried to plot the magnitude of transfer function using Matlab.

\$ H(\omega) = \frac{V_0}{V_i} = \frac{R}{R + j\omega L + 1/j\omega C} = \frac{R}{R + j(\omega L - 1/\omega C)} \$

schematic

simulate this circuit – Schematic created using CircuitLab

Matlab code:

%% Band-pass filter

R = 1;
C = 1;
L = .02;
w = 0:.01:10;
H = R ./ (R + 1i*(w * L - 1./(w * C)));
mag = abs(H);


% plot magnitude
figure(3), clf
plot(w, mag);
title('Frequency response of RLC series resonent circuit')
xlabel('\omega'), ylabel('|H(\omega)|')
hold on
% plot center frequency
w_center = 1 / sqrt(L*C); 
plot([w_center w_center], get(gca, 'ylim'), 'r--')
plot(get(gca, 'xlim'), [.7071 .7071], 'r--')

How do I choose the value of R, L and C that can plot the actual curve below as same as possible.

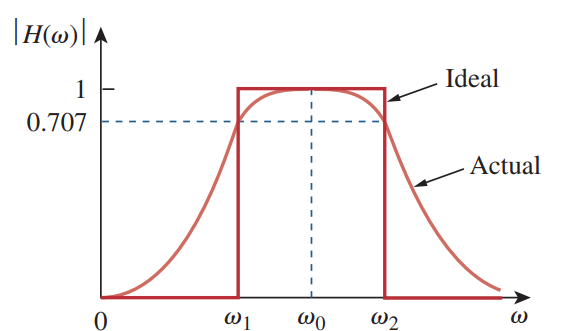
enter image description here

\$\endgroup\$
1
  • \$\begingroup\$ It never looks exactly like this for a 2nd order filter. on a linear f or log f scale or linear amplitude scale. Plot it on a log-log scale with increments of wL/R for 3.10,30,100 by reducing R for L/C=1e6 \$\endgroup\$
    – D.A.S.
    Commented Jan 21, 2020 at 5:15

2 Answers 2

1
\$\begingroup\$

You could use the Laplace transform, and the 'bode' command in Matlab:

\$G(s)=\frac{RCs}{s^2LC+sCR+R}\$

Then in Matlab, immediate mode, and using the component values given in the OP: :

num=[1 0];

den=[0.02 1 1];

g=tf(num, den);

bode(g)

\$\endgroup\$
0
\$\begingroup\$

How do I choose the value of R, L and C that can plot the actual curve below as same as possible.
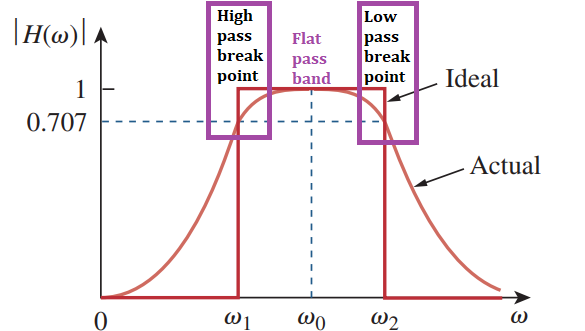
It won't exactly look like that curve at all because your desired curve is not modeled by a simple 2nd order band pass filter. It looks to me more like a low pass filter cascaded with a high pass filter i.e. it has two break points as per below: -

enter image description here

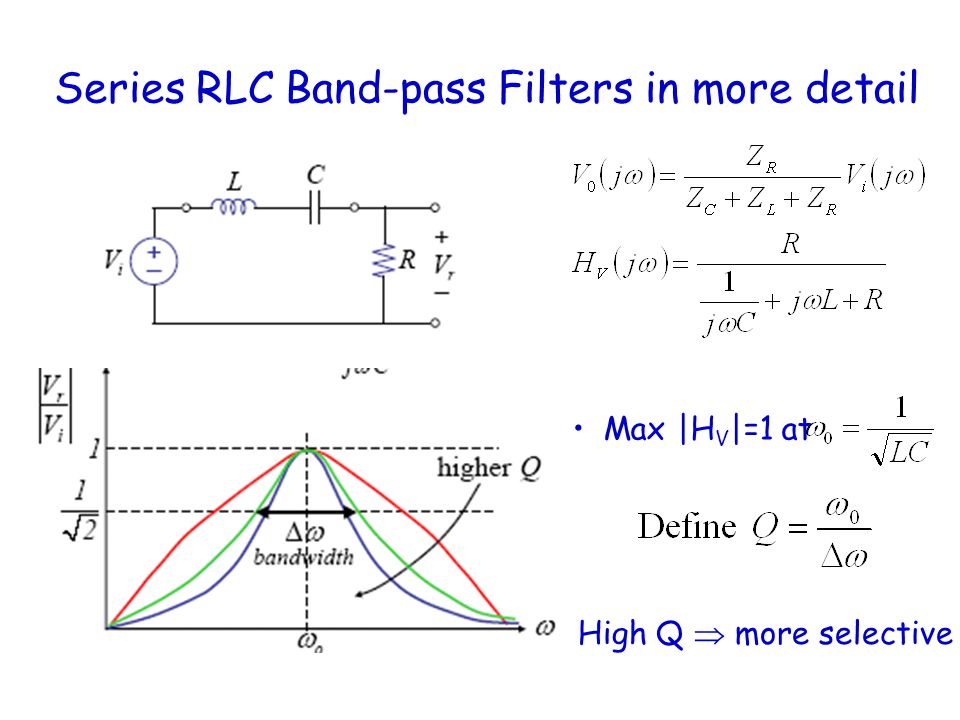
A series band pass filter that you hope to use will look more like this: -

enter image description here

Picture above from this slide player

Notice the lack of a flat top to the pass band (required in your original diagram).

I might suggest you use two first order filters set at the two breakpoint frequencies but, without knowing \$\omega_1\$ or \$\omega_2\$ it's difficult to make recommendations.

\$\endgroup\$
1
  • \$\begingroup\$ Thank you for illustration. I appreciate it. \$\endgroup\$
    – nova0609
    Commented Jan 23, 2020 at 6:17

Your Answer

By clicking “Post Your Answer”, you agree to our terms of service and acknowledge you have read our privacy policy.

Not the answer you're looking for? Browse other questions tagged or ask your own question.