0
\$\begingroup\$

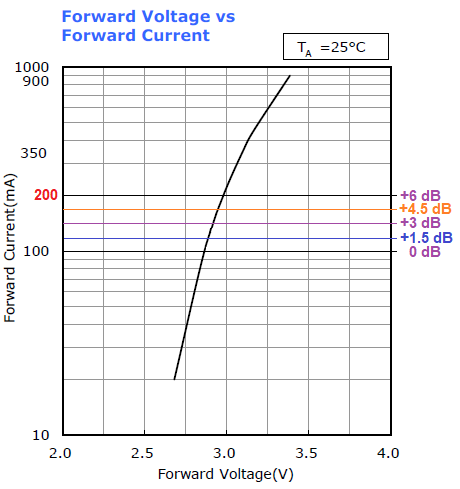
I have a LED voltage vs current graph. The forward current is represented in a log scale.

Suppose my value is 120mA. Where should I place my point and what would be my forward voltage with respect to the below graph?

enter image description here

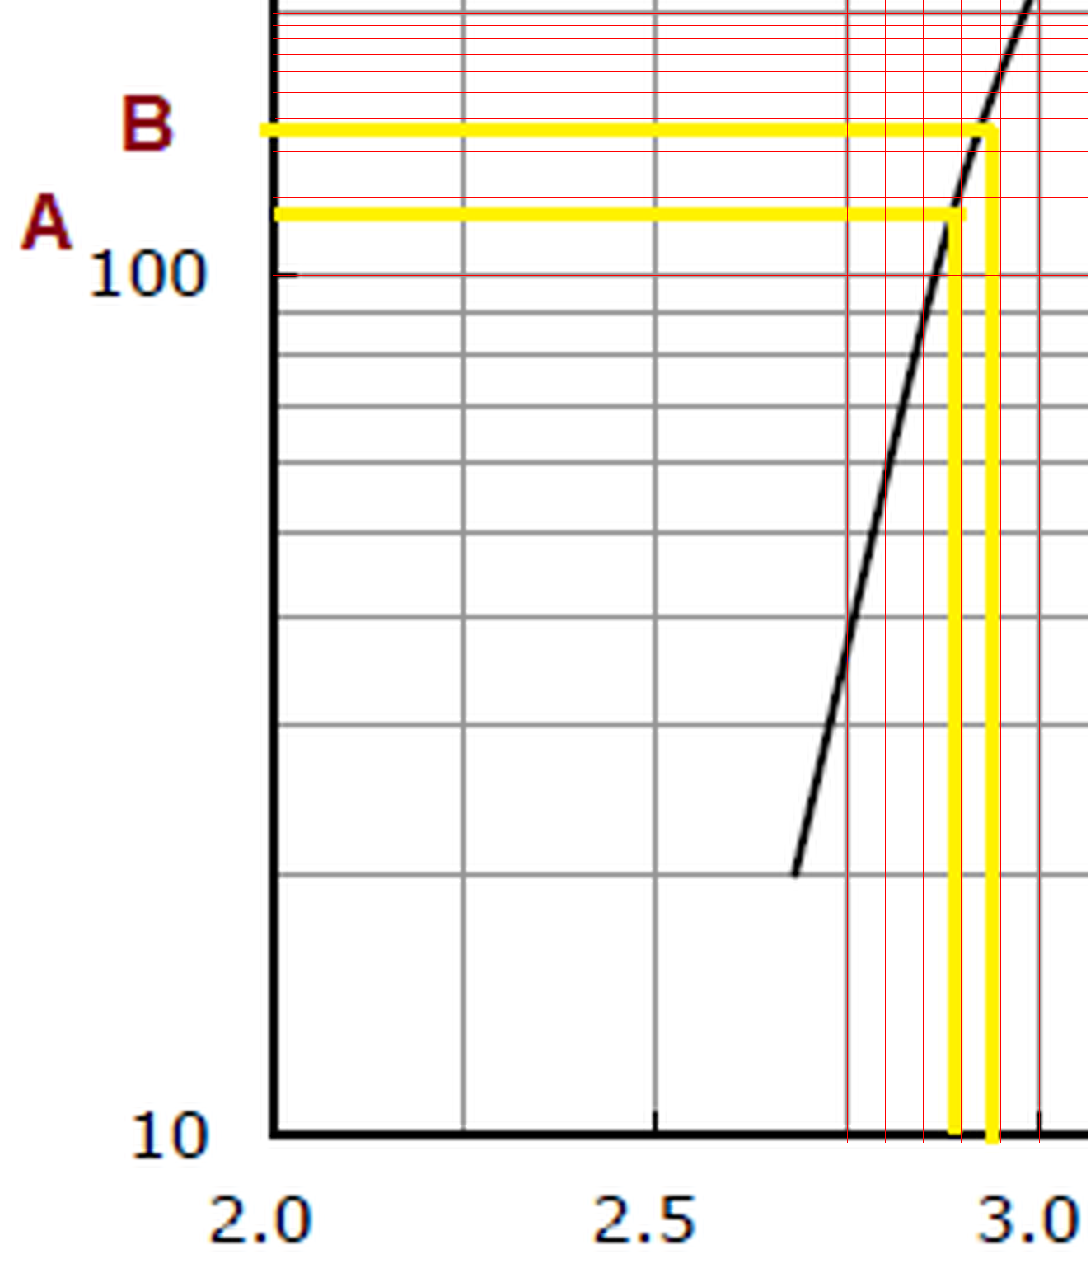
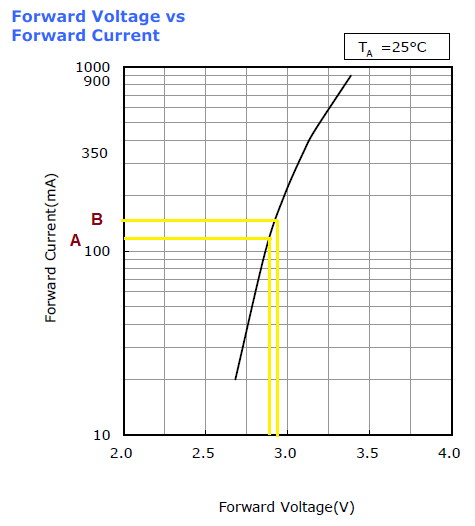
Like, should I split the box between the 100mA and 200mA in normal decimal scale (point A) or log scale (point B)?

\$\endgroup\$
1
  • 1
    \$\begingroup\$ A bit more on what Elliot Alderson said. Graphs like this one are pretty much useless from a design standpoint. Error bars or some other indication of a range of performance might make the the graph more useful. But from a design standpoint, you need to use the worst case, min/max guaranteed values list in a table someplace in the data sheet. \$\endgroup\$
    – SteveSh
    Commented Feb 16, 2021 at 13:28

4 Answers 4

1
\$\begingroup\$

suppose my value is 120mA, where should I place my point

If you split part of the vertical scale into decibel ratios you can get close to a line that corresponds with 120 mA forward current: -

enter image description here

So, I've made 100 mA = 0 dB and I've made 200 mA = 6 dB. Of course, as we know, 200 is 6 dB higher in signal magnitude than 100 mA. Strictly speaking a 2:1 ratio is 6.02 dB but that 0.02 dB error is miniscule given the graphs physical resolution.

120 mA is 1.58 dB above 100 mA so, the 120 mA line will be roughly where the +1.5 dB blue line is. The corresponding forward voltage is around 2.8 volts.

\$\endgroup\$
1
\$\begingroup\$

You are trying to get more information from the graph then is really there. Remember that this graph is for a typical LED and the device you have in your hand may be significantly different. The graph shows you the shape of the relationship between current and forward voltage, but it can't give you an exact value for any given physical LED.

If you need numbers then you must use the tables of specifications, not the graphs of typical behavior.

\$\endgroup\$
1
\$\begingroup\$

Nothing stopping you from putting log scale and linear scale on it.

Use the big log scale (or even the small log scale) to create a graphic in some graphic program. Group it. Then scale.

Linear, 6 lines. Align edges and space evenly.

If \$I_F\$ = 120mA, then \$V_F\$ = 2.94V.

A = 108, say 110mA and 2.9V. B = 128, say 130mA and 2.95V.

enter image description here

\$\endgroup\$
0
\$\begingroup\$

When reading log charts like this you must ESTIMATE to find values between the drawn lines.

In your case I would estimate the "A" point to be: (2.875, 110) and "B" to be: (2.95, 160)

It's just a quick guess and more careful measurements and some arithmetic would get you closer.

\$\endgroup\$

Your Answer

By clicking “Post Your Answer”, you agree to our terms of service and acknowledge you have read our privacy policy.