I have to find Is an N from the datasheet of diodes 1N4004 and 1N4148. I did this by estimating both of these by accomodating a straight line in the log-linear Id vs Vd graph in the datasheet of each diode. Is there a different way of getting to know these two parameters form de datasheet? Thanks.
-
\$\begingroup\$ Look at this answer and search for the Python code for diodes. You'll need at least three measurements. \$\endgroup\$– jonkCommented Apr 12, 2021 at 0:37
-
\$\begingroup\$ Any questions, at all? I believe I've made things as concrete as possible. If it is your goal for us to criticize your own method, you'll have to disclose its details as well as provide us with an example of how you'd apply it to a specific datasheet example. \$\endgroup\$– jonkCommented Apr 12, 2021 at 18:17
1 Answer
There are at least three, not two, important parameters when looking at the datasheet. Also, you need to apply as much precision as you can, within the limits available to you in a chart. These are the series resistance, the saturation current, and the (non-)ideality factor. So it takes at least three measurement points to extract these.
At first, it may seem that more points are better, as the fitting process is basically an integration process (the summations indicated by partial derivatives take place) and therefore will tend to better mitigate random errors. But humans reading charts may be more likely to develop systematic errors. So I tend to imagine it is okay to just take your best shot at getting three points from the charts, splitting two end-points by a third point about midway between them.
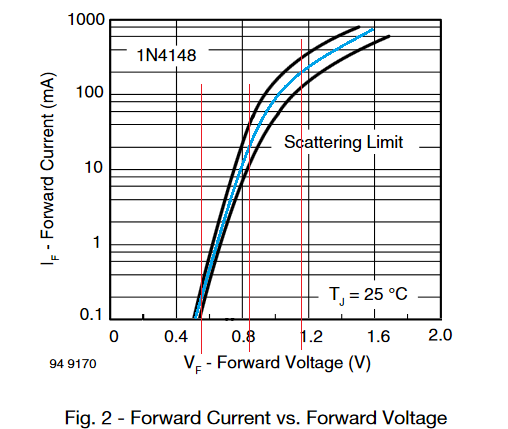
Here's an example from Vishay's chart for the 1N4148 datasheet:
I've added a blue average curve through their two scattering limit curves and then "red-lined" three selected points.
These points were measured on a pixel basis and the results are:\$\left[\begin{array}{cc}552\:\text{mV}& 200\:\mu\text{A}\\842\:\text{mV}& 20\:\text{mA}\\1.158\:\text{V}& 200\:\text{mA}\end{array}\right]\$
Plugging these into Python code running on Sage, I get: \$R \approx 1.005\:\Omega\$, \$I_\text{SAT}\approx 16.41\:\text{nA}\$, and \$N \approx 2.283\$.
The code I used is:
def diode():
    print( "This program uses 3 diode measurements to extract parameters." )
    print( "You will need to have taken these measurements beforehand." )
    print( "Enter each point as [ <diode current>, <diode voltage> ]." )
    print( "" )
    TA= int( input( "Enter the ambient temperature in Celsius (default is 27 C): " ) or "27" )
    print( "" )
    VT= 8.61733034e-5 * ( 273.15 + TA )
    POINTS= []
    vd, id, N, ISAT, RS= symbols( "vd id N ISAT RS" )
    for i in range(3):
        pid, pvd= input( "Enter point " + str(i) + ": " ).split()
        POINTS.append( { vd: float( pvd ), id: float( pid ) } )
    EQS= []
    for i in range(3):
        EQS.append( Eq( POINTS[i][vd], RS*POINTS[i][id] + N*VT*ln(POINTS[i][id]) - N*VT*ISAT ) )
    print( POINTS )
    print( EQS )
    ANS= solve( EQS, [ RS, N, ISAT ] )[0]
    print( "RS   = " + str(ANS[0]) )
    print( "N    = " + str(ANS[1]) )
    print( "ISAT = " + str(exp(ANS[2])) )
That said, you are free to work out your own method. But I'd strongly recommend that you keep in mind that there is bulk, contact, and lead resistance that should be incorporated in the process you use. The reason is pretty simple. The shape of the curves you see will be impacted by it and if you don't account for it then your other two numbers will be still further apart from reality, than otherwise. It's difficult enough getting decent data points off of a chart, as it is, not to make it worse by neglecting an important parameter.
The above code is actually somewhat more robust on \$N\$ than it is on the other parameters. So it's probably useful for what you want, I think.

