3
\$\begingroup\$

Background

I have a load at the end of a fairly long cable which can accept a limited range of DC voltages. As the acceptable voltages are quite low, I'm expecting non-negligible (read considerable) losses on the conductors themselves. I don't have the option of transmitting a higher voltage and stepping down nearer to the load.

Maths

I'm not an electrical engineer, but I remember the basics so I've modelled my system as below: where R is the one-way resistance of the long conductor and my load requires power, P (which we'll assume is constant).
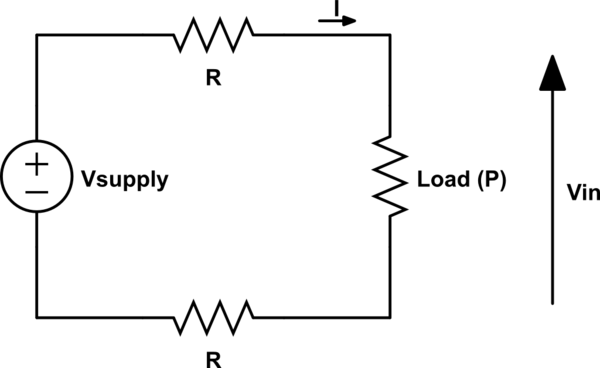
schematic

simulate this circuit – Schematic created using CircuitLab

Current anywhere can be calculated from the known P of the load: I = P / Vin (where Vin is a value chosen from within the acceptable range for the Load).

The losses in the cable are given by: Vloss = I * 2R = P * 2R / Vin

Now, I want to know the required supply voltage to ensure I receive a given Vin across the load.

Vsupply = Vin + Vloss = Vin + P * 2R / Vin

If I've got that wrong I'll be embarrassed.

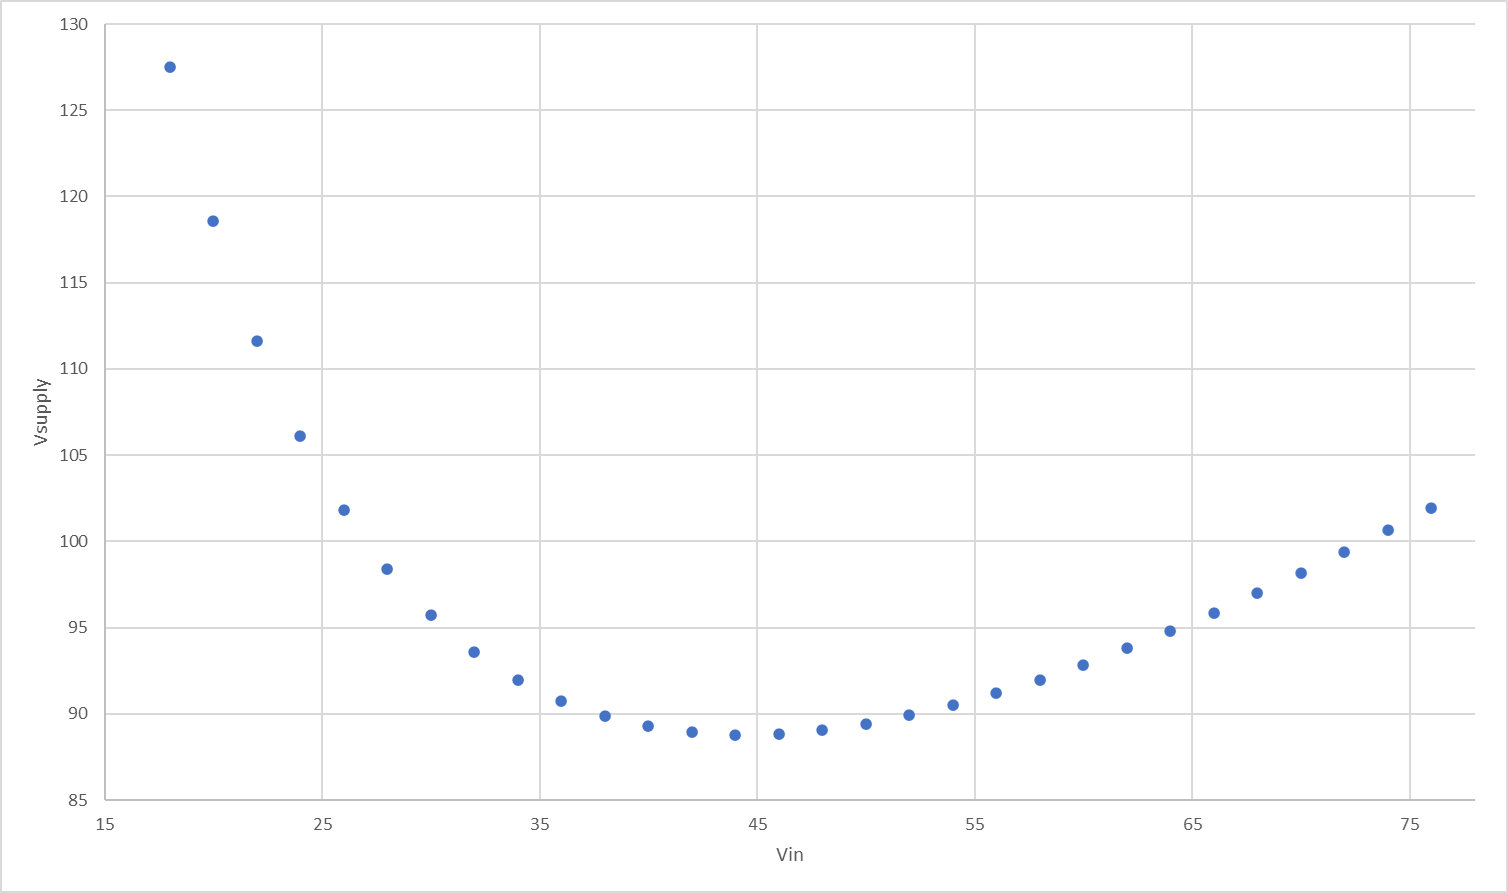
The thing that confuses me is looking at the equation, for plenty of values of P and R, the graph of Vsupply given Vin is hockey stick shaped. This means that (while any given value of Vin gives only one value of Vsupply) if I were to work backwards with a known value of Vsupply, reading off my graph would give me two possible values for Vin! I don't see how this can be.

Example with real values

  • 18 VDC <= Vin <= 75VDC (load is actually behind a little DC-DC converter with this range of accepted input voltage)
  • P = ~19.25W (calculated as the peak power drawn by the circuit on the converter's output multiplied up for efficiency losses in the converter itself).
  • R = ~51R

My graph will look like this A graph of Vsupply for a given Vin

So, it's easy to read off that if I want a Vin of 44V apparently I need to supply ~89V. But if I supply 90V, what Vin will I get? ~38V or ~52V?

I would love to understand what I'm missing or getting wrong here. Thanks.

\$\endgroup\$
1
  • \$\begingroup\$ I've updated my answer radically, make sure you understand the new conclusion. \$\endgroup\$
    – Neil_UK
    Commented Feb 4, 2022 at 5:42

2 Answers 2

6
\$\begingroup\$

What you're missing is the consequence of you specifying a constant load power P.

The load is behind a DC-DC converter, so it always draws enough current to be powered by its input voltage. As the input voltage goes up, the current it needs to draw goes down. That means it's exhibiting a negative input resistance.

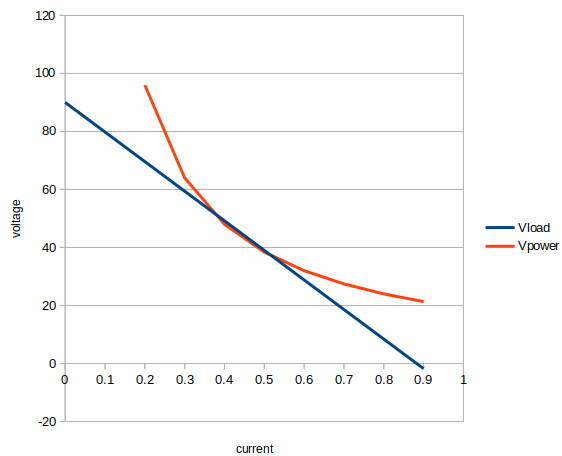
The best way to see what's happening is to draw a 'Load Line' graph

enter image description here

This is for a supply voltage of 90 V, with a 102 ohm total loss resistance. The blue line is the load line for this supply. When the load current is zero, the line output voltage (your Vin!) is 90 V, and the short circuit current is about 900 mA. The line resistance drops the output voltage linearly as the current through it rises, hence the straight line (which makes this a very easy graph to draw). The red line is the 19.2 W hyperbola.

It appears that there are two solutions, two intersections of the load line and the power line, at about 35 V and 50 V. However, only the 50 V one is stable. The low voltage one is unstable, and (assuming the DC-DC converter continues to behave like a constant power input, which it won't at very low input voltage) will quickly drop to zero volts if it's below 35 V, and quickly rise to 50 V if it's above 35 V.

This means that to start up this arrangement, you have to ensure that the voltage at the end of the line is above 35 V before the load starts drawing current. This can be done with a capacitor at the far end, which can charge any input capacitors on the input of the DC-DC converter when it's connected.

Even when operating at the 50 V point, you're not finished with possible problems. The converter's negative input resistance means it can cause the operating conditions to oscillate. The feed-line inductance, together with the converter's input capacitance, and any startup capacitance you've added at the far end of the line, will form a resonant circuit. If it has sufficient Q, then the negative resistance of the converter input will build up an oscillation of the operating point. Keeping the capacitance large and the inductance small will keep the L/C ratio down, allowing the line loss to keep the Q down. Fortunately, adding a large capacitance is easy to do, and a fairly intuitive thing to stop oscillation. Just make sure you don't add excess inductance to your feed wires.

\$\endgroup\$
4
  • \$\begingroup\$ It's worth understanding the style of a load line graph, because you'll see them everywhere for all sorts of purposes - biasing transistors, understanding how LED current changes with LED voltage, communicating power withstanding of transistors in data sheets, determining gain of active devices. \$\endgroup\$
    – Neil_UK
    Commented Feb 3, 2022 at 17:32
  • \$\begingroup\$ Thanks, yes, I can see the utility of the load line graph clearly. Could I ask for some detail on the bistability? The 35V solution is clearly less desirable than the 50V one, but why is unstable? \$\endgroup\$
    – JRVeale
    Commented Feb 7, 2022 at 12:58
  • 1
    \$\begingroup\$ @JRVeale When used to loadline graphs, one can tell from the slopes. Determine the dynamic resistance of a constant power load, either analytically or with a spreadsheet. That load will be in parallel ( ! not series, both V+ and GND are ground, as far as impedance goes) with the line resistance. At the 35 V point, the total resistance is -ve, which means unstable. At the 50 V point, the load is still -ve resistance, but paralleling with the line resistance brings it net positive, so it's stable. Try putting it into a SPICE simulator and use initial conditions to start it where required. \$\endgroup\$
    – Neil_UK
    Commented Feb 7, 2022 at 13:52
  • 1
    \$\begingroup\$ @JRVeale What's more interesting is if the 50 V point is stable, then why can it oscillate? The point is that it takes some series inductance in the line to make it oscillate. At some frequency, the series inductance increases the impedance of the line, so that when paralleled with the load's negative impedance, it can no longer pull it positive. Increasing the capacitance across the load can be described as either 'reducing the LC ratio', or 'reducing the resonant frequency so the impedance of the L is lower, allowing the line to make the total resistance positive'. \$\endgroup\$
    – Neil_UK
    Commented Feb 7, 2022 at 14:24
2
\$\begingroup\$

The application note below appears to be a comprehensive analysis and also describes how to avoid bistability.

Application Note 1366 - Source Resistance: The Efficiency Killer in DC-DC Converter Circuits

https://www.maximintegrated.com/en/design/technical-documents/app-notes/3/3166.html

This paper describes stability issues that may be caused by the input source impedance of a DC-DC converter:

https://www.all-electronics.de/wp-content/uploads/2016/11/wp_tech_tip_input_source_impedance.pdf

\$\endgroup\$

Your Answer

By clicking “Post Your Answer”, you agree to our terms of service and acknowledge you have read our privacy policy.

Not the answer you're looking for? Browse other questions tagged or ask your own question.