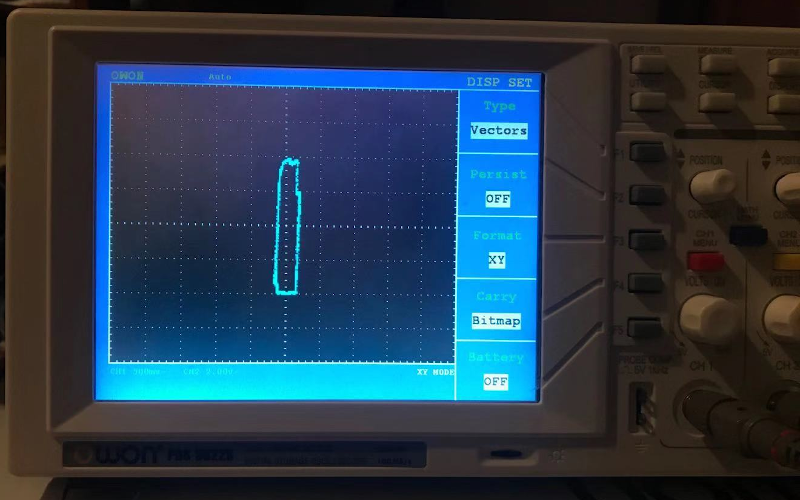
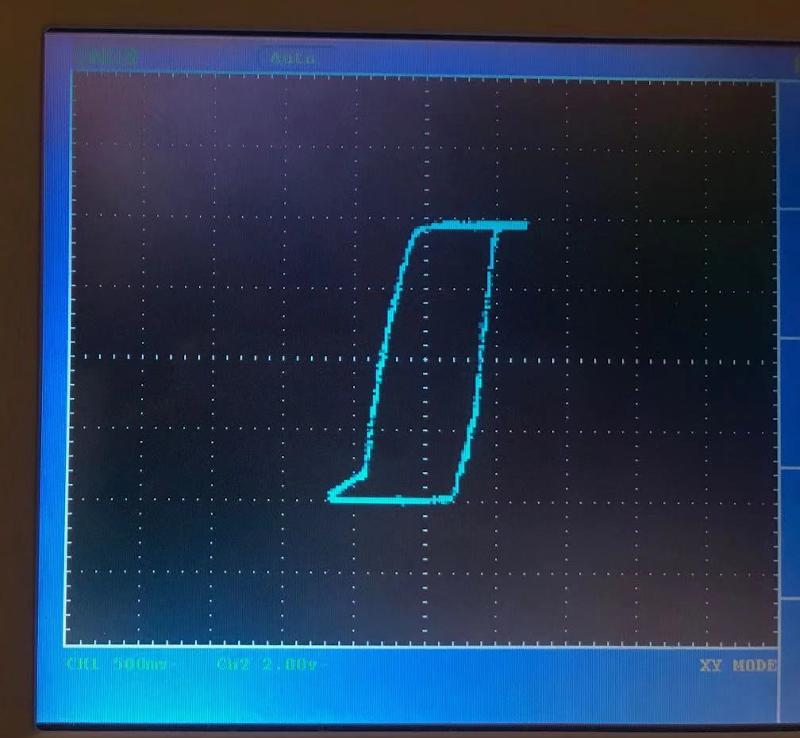
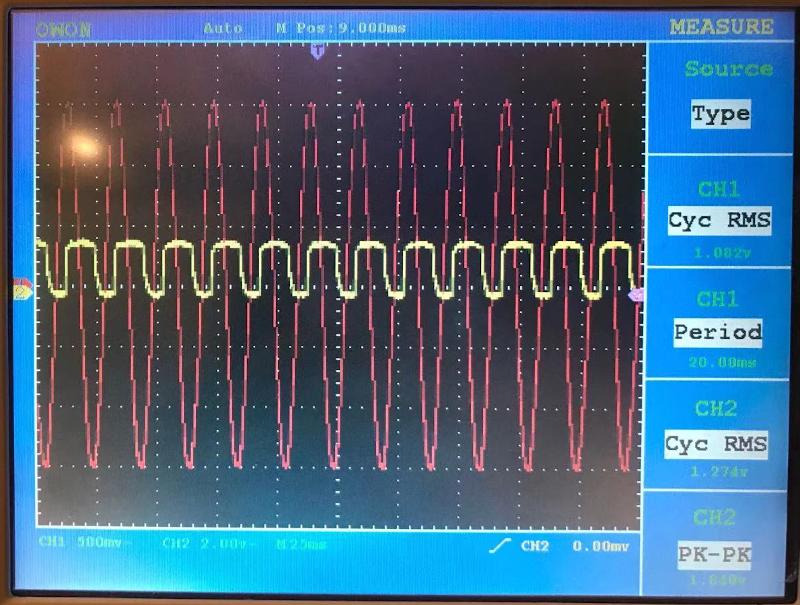
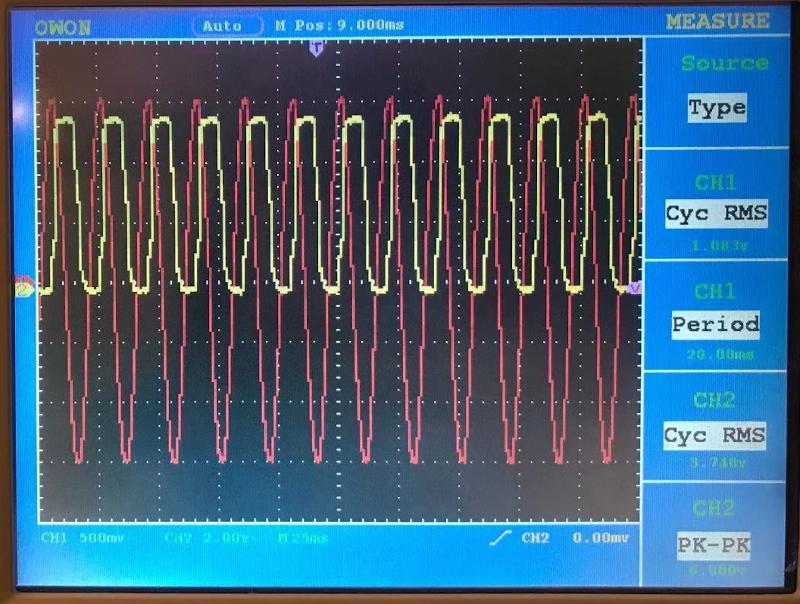
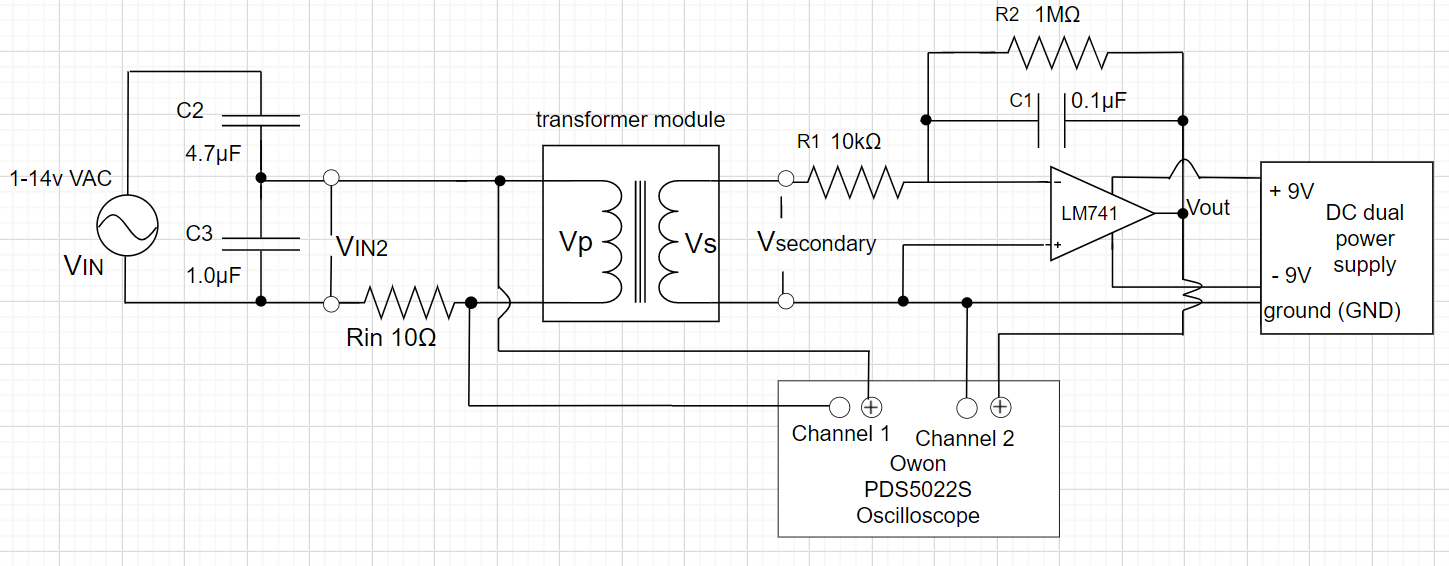
I am trying to find out the hysteresis curve of a transformer iron core. I use an LM741 for the op-amp integrator.
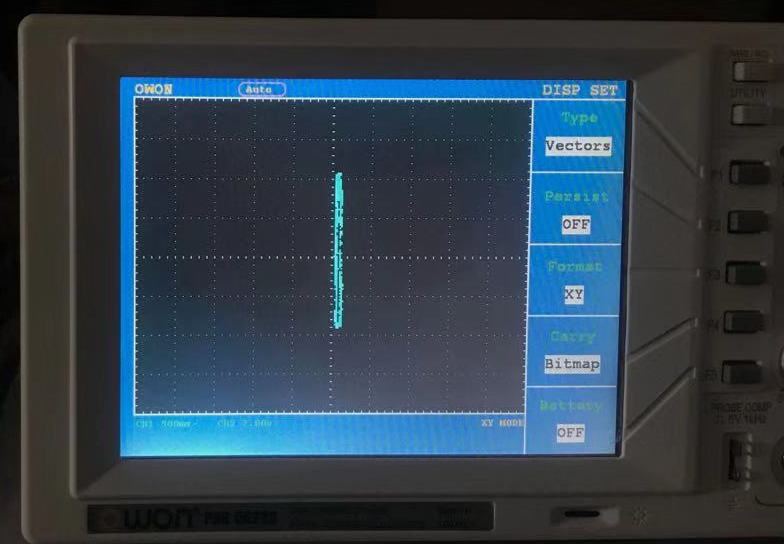
As I increase my 50Hz input voltage, I observe that Vin (value on the x-axis) does increase, while Vout (on the y-axis) increases very little. This does look like it is getting saturated, but I haven't seen the "linear region" on a B-H curve.
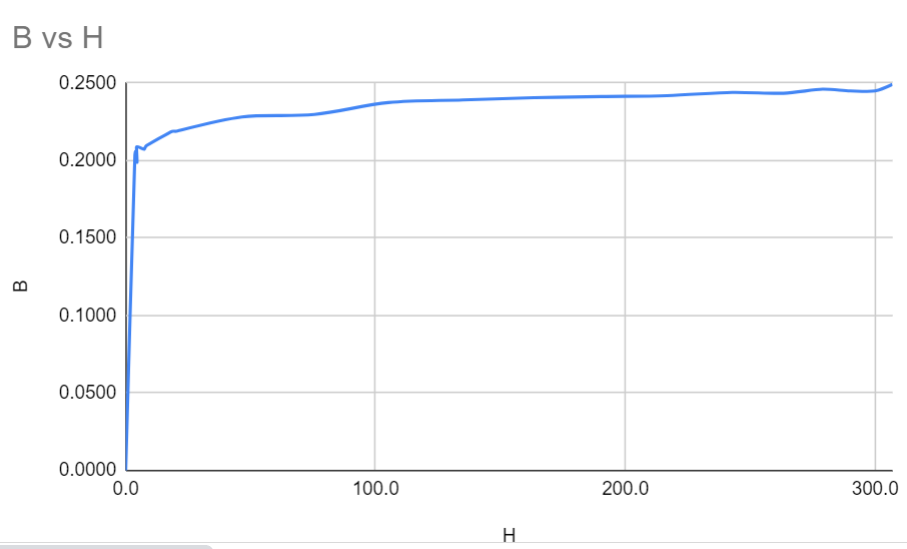
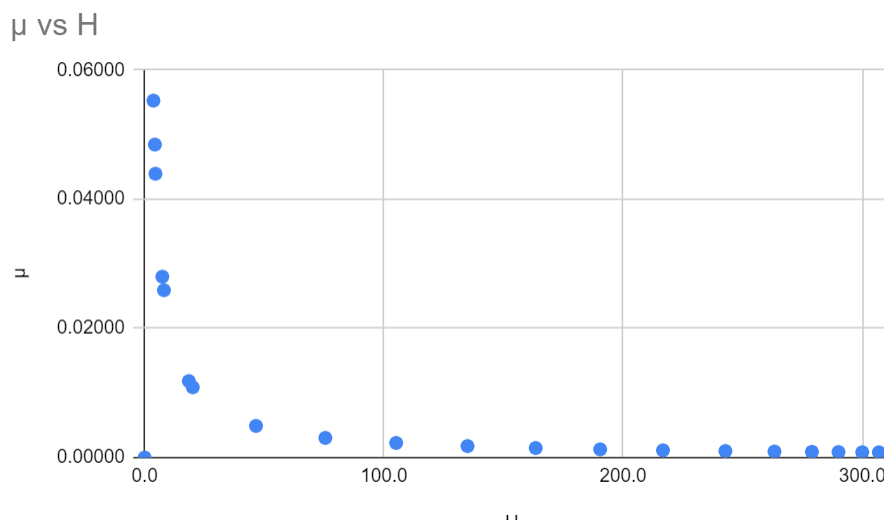
To find out why, I measured some data points, calculated B, H, and permeability with my other data, and plotted B vs H and permeability vs H. The left part of the graph is different from what it theoretically should be.
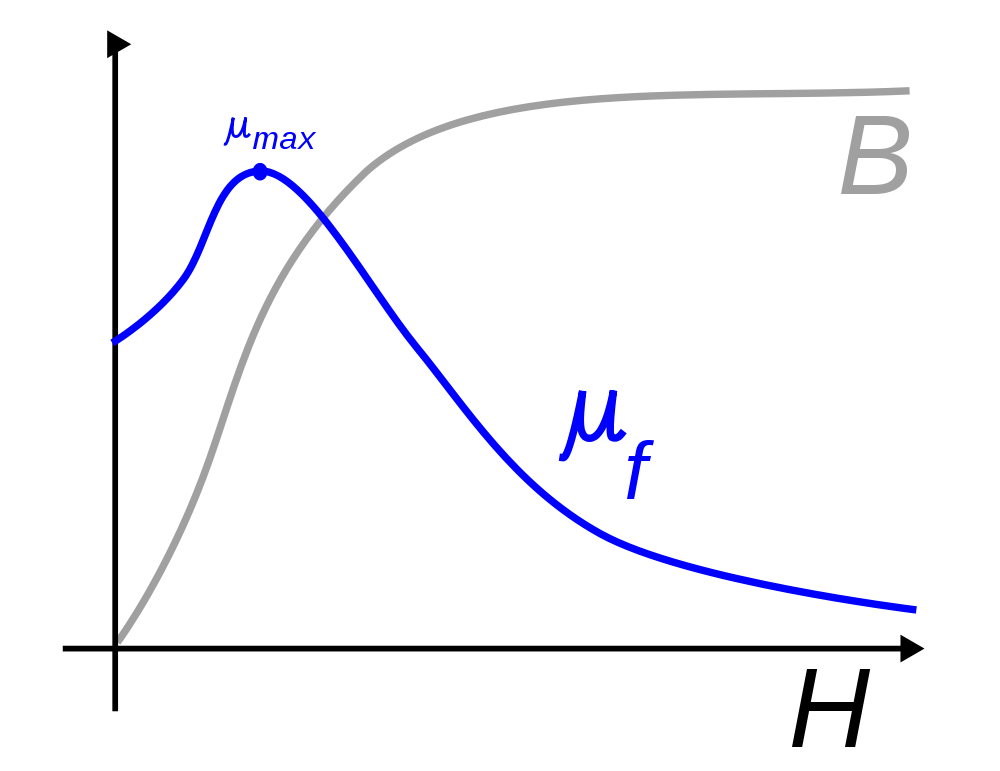
Theoretically, there should be a curve at the beginning(shown in the 3rd picture), which contains a section with a linear B-H relationship, but my B values are already so high at the very beginning.
I suspect that it's because Vout value also reflects the +-9v DC supply voltage for the opamp. I suspect this, because as I increased the DC supply, Vout increased too, which increased the height of the hysteresis curve.(just for testing, The DC supply was constantly +-9v in other times)
This makes the y-axis value already pretty high when my input voltage was only 0.02116v. Every time as I only increase a little Vin, this causes little Vout change. Thus, negligible changes on the y-axis are observed.
The iron core can't saturate already at 0.02116v, right? It approaches saturation so fast that it seems wrong. My measured permeability doesn't have a trend line at the beginning that leads up to its maximum point.
Am I just thinking too much or is something wrong?

