I thought I knew this, but now I'm learning more. I have 2 scenarios that seem the same, but have conflicting results.
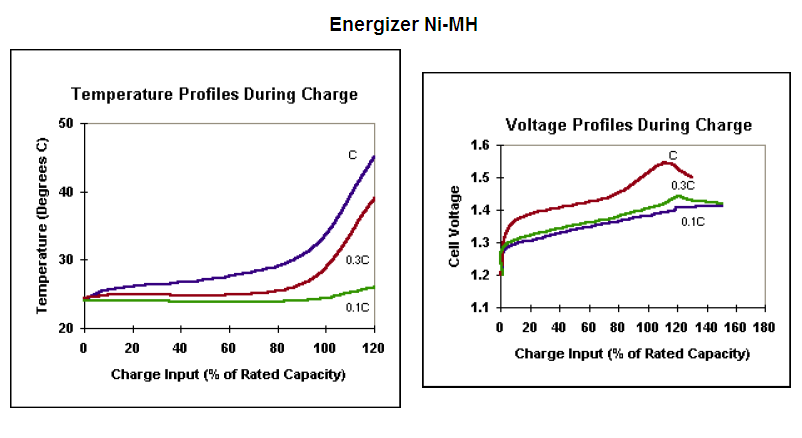
Scenario 1. 16x AA NiMH in series to recharge, I set CC to 10%, the voltage starts out low around 18v-ish, then over 12-15h the voltage climbs up to 23.5v-ish, then its done. Each cell has 1.4v. Easy, reliable.
Scenario 2. 4x AA NiMH in series to recharge, I set CC to 10%, the voltage starts out HIGH, around 7v...? I don't know what to do. The voltage without the benchtop is 5.2.
I see other scenarios with people starting with higher voltage, then observing the current drop...this must be CV right? (When batteries get older do they have more resistance?) I prefer CC if there's a choice. So my first question is how am I getting both high and low charging voltages when using CC in seemingly equal examples? And question number 2, how will I know when a battery is no longer charging/dead? (My first guess is that there's a dead cell in the series, but I don't know how to test for that).
Thank you kindly in advance!
Edit 1: I simplified. 2x (same mAh) of scenario 1 batteries (newer) against 2x scenario 2 batteries (older)...definitely the same setup, still low and high voltage respectively. I'm suspecting that as batteries age their resistance goes up which is why it takes more voltage to charge them. And when resistance becomes too high then the battery is dead. Is this right?

