2
\$\begingroup\$

enter image description here

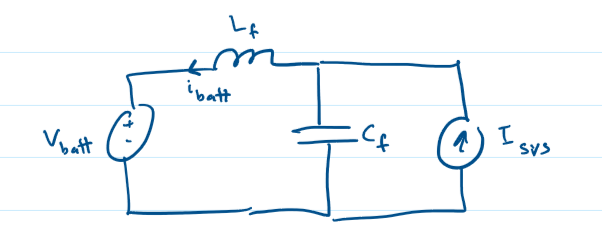
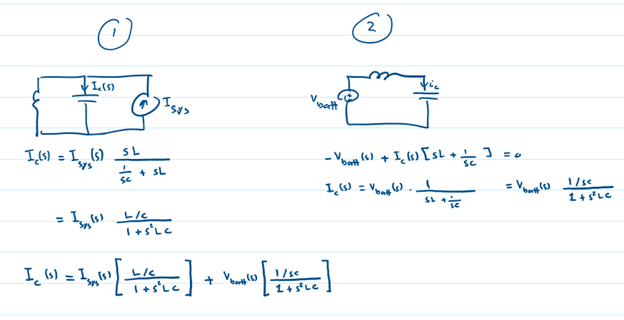
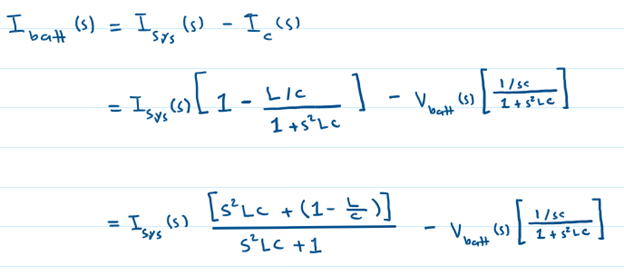
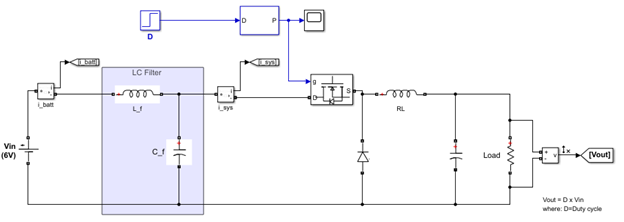
In the figure above, I am trying to design an input filter that attenuates all switching frequency harmonics from i_sys, such that i_batt is a DC current with vary small ripples. My approach is to get the transfer function of i_batt/i_sys then set the magnitude of the transfer function to a very small value at the switching frequency. From there I can get the L_f and C_f values. Below is my attempt to derive the transfer function:

By super position:

enter image description here enter image description here enter image description here

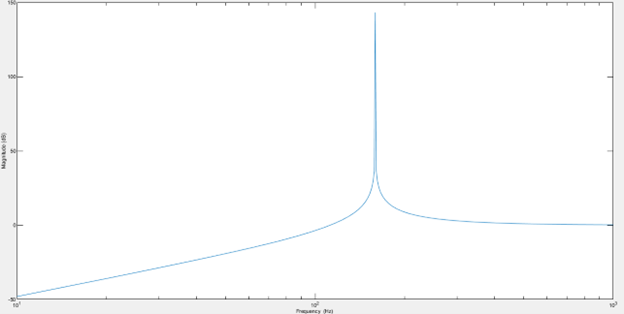
I only care about the G_bs(s)=I_batt(S)/I_sys(S) behavior, and the poles of this portion is j1/sqrt(LC). The bode plot of G_bs with arbitrary values for L and C is:

enter image description here

Something looks off about all of this, this is not the plot I am used to seeing in literature. Can someone give me any insight on what went wrong? Perhaps my derivation is not correct?

\$\endgroup\$

1 Answer 1

6
\$\begingroup\$

If you want to derive the transfer function linking the current signature of the buck converter to the current going to the battery, you don't need to include the battery voltage in the calculation:

enter image description here

I gave a working example in my APEC 2017 seminar on EMI filter interaction with switching converters, slide 80. If you want to derive the transfer function linking the injected current of your buck converter to the current injected in the battery, you can use the fast analytical circuits techniques or FACTs as described in my book on the subject. The sketches are shown below and all is done by inspecting the circuits - no equation - so a simple process:
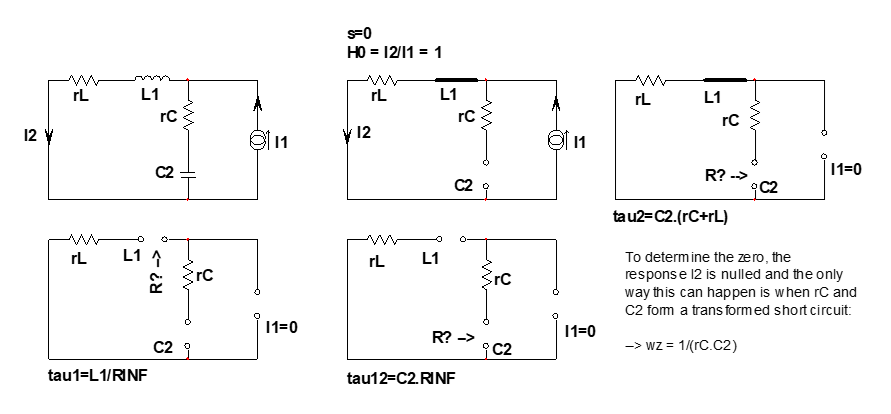
enter image description here

Once you have all the time constants you need, assemble them in a Mathcad sheet and compare the response with a SIMetrix plot:
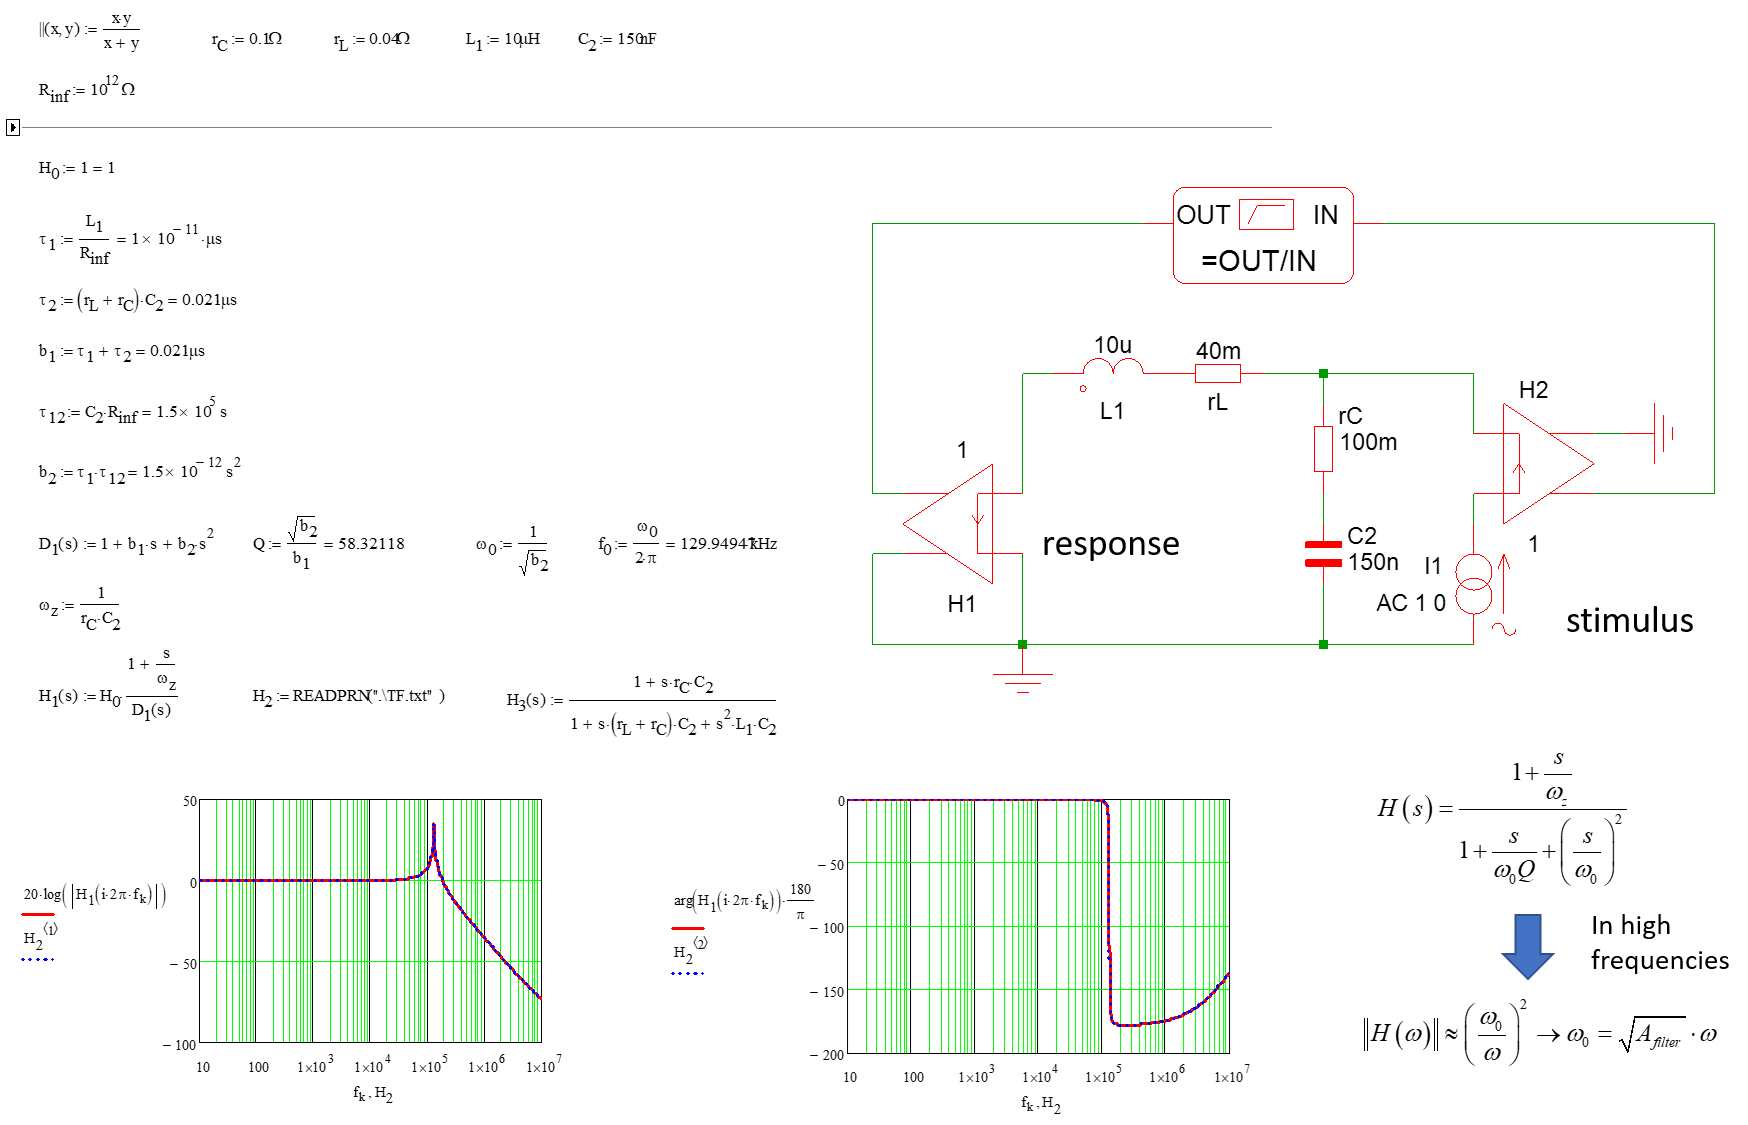
enter image description here

The interesting result is the one located in the low-side right-corner and it links the high-frequency magnitude with the attenuation you want noted \$A_{filter}\$. The flow is a follows:

  1. determine the worst-case signature of the buck converter
  2. extract the fundamental value of the input current \$I_1\$ with an FFT, e.g. 1 A
  3. determine the ripple current you can accept in the battery, perhaps 15 mA at 10 kHz
  4. determine the filter attenuation at 10 kHz, 15m/1 = 15m or -36.5 dB
  5. position the cutoff frequency at \$\sqrt{0.015}\cdot 10k=\$1.2 kHz.
  6. check the attenuation at 10 kHz with the computed values:
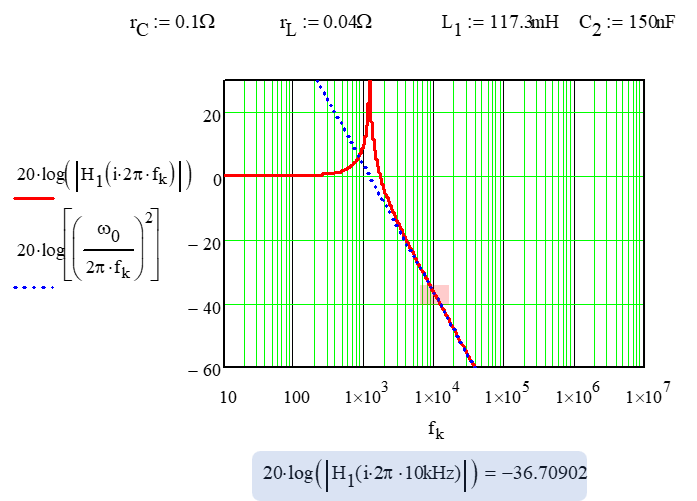
enter image description here

I recommend to include the parasitics like the equivalent series resistors (ESR) of the capacitor and the inductor, \$r_C\$ and \$r_L\$, as they affect the transfer function and can defeat the response in some cases. Once you have the \$C\$ and \$L\$ values, you can complicate their model (in simulation) to include parasitic resonances and approach what you will have on the bench in the end. Watch out then for the interaction between this filter and the downstream converter as detailed in my APEC seminar.

\$\endgroup\$
2
  • \$\begingroup\$ sir, you are a saint among mortals when it comes to helping others. Your answer was so great, it made my day and probably the day of my ancestors too! Thank you so much. By the way, you mentioned a seminar previously, I searched for it using the title you provided but was unable to find any recorded videos. If you have one available, it would be great if you could share it with learners like me. \$\endgroup\$
    – amidher
    Commented Jan 26, 2023 at 12:10
  • \$\begingroup\$ Hello, with pleasure if I could help you! : ) I don't have recorded sessions so far of my seminars but I may look into this when time permits. What seminar in particular did you have in mind? \$\endgroup\$ Commented Jan 26, 2023 at 13:02

Your Answer

By clicking “Post Your Answer”, you agree to our terms of service and acknowledge you have read our privacy policy.

Not the answer you're looking for? Browse other questions tagged or ask your own question.