In my experiment I am collecting data from 2 oscilloscopes (both Tektronix, MDO3024 and TBS2000B).
I am using all channels in both scopes, so 8 channels of data (3 x current, 1 x pwm, 3 x voltage and 1 x slow pwm).
I fetch the data to connected PC.
The problem arises when I want to merge the data from both scopes.
Explanation:
"Acquire" menu allows me to set number of points collected:
- in case of TBS2000B i can select from: 1k, 2k, 20k, 200k, 2M, 5M points.
- MDO3024 has options for: 1k, 10k, 100k, 1M, 5M, 10M points.
It seems to be fine, but: TBS2000B has points collected across 15 time divisions, and MDO3024 across 10 time divisions.
This creates non-matching distribution of samples in time, thus making it hard to align.
No one was looking at this in the moment of buying scopes for our lab.
Also, there is no option to set the number of points recorded to be, for example 1.5M in the scope with time 15divs, and 1M with the scope of time 10divs. This would be ideal solution. (Maybe Tekronix can do firmware upgrade?)
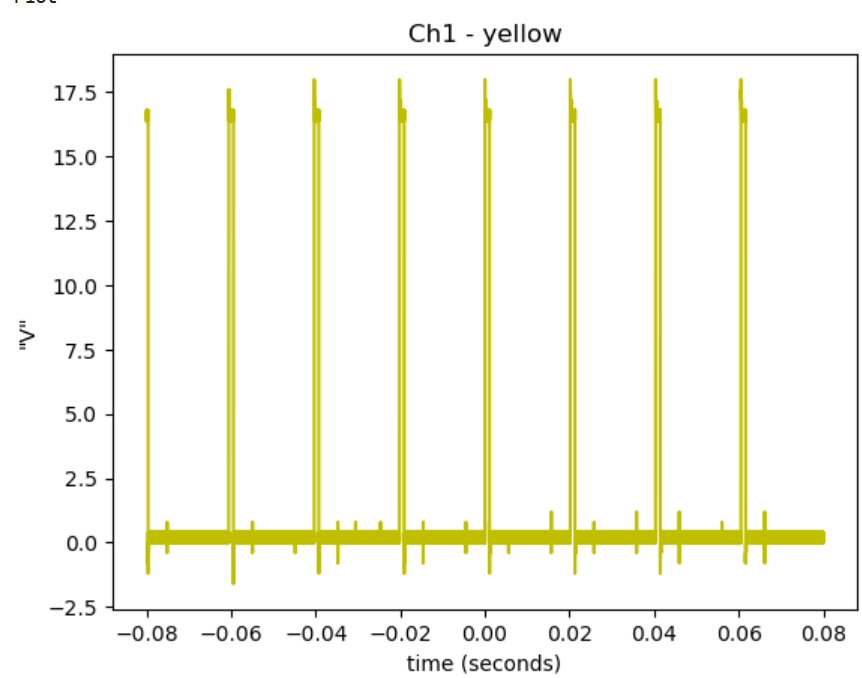
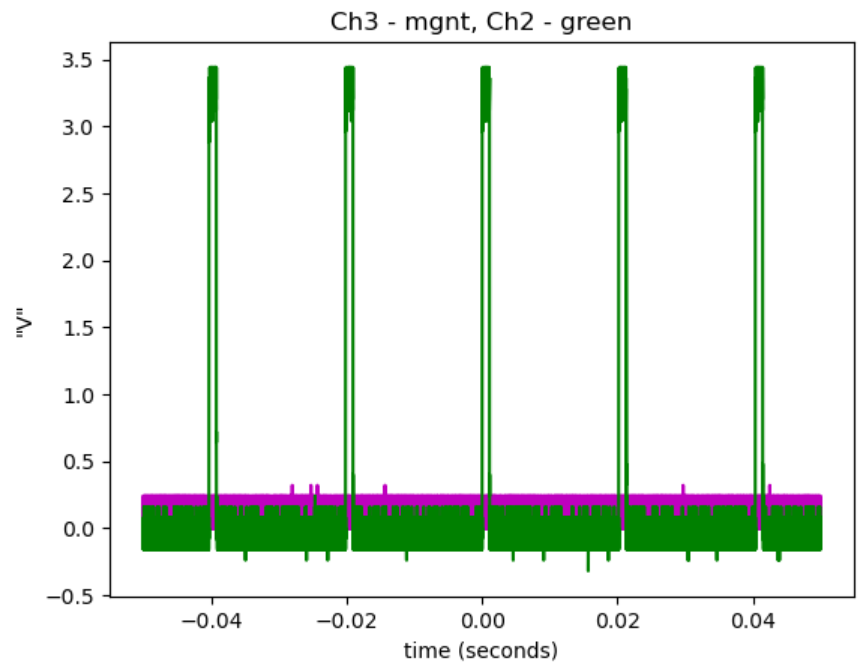
As picture say more than 1k words, here are plots, the same simple signal collected with mentioned two scopes (don't look volt values, I didn't workout the x values yet):
TBS2000B data visualisation. 10ms/div, 5M points
MDO3024 data visualisation. 10ms/div, 5M points
For now I am using python script and np arrays with some tricks to adjust data (trimming excess from TBS data and approximate values between samples in time), but I would like to set the scopes in a way I can trim excess data from TBS2000B instead finding approximates between points.
Maybe there is a combination of time base vs record length(num of samples fetched) where it would be possible? This seems to be a math problem.
My question is if someone had a similar problem and the way to sort it out without approximation method?


