1
\$\begingroup\$

I'm trying to analyse the AC response of a transimpedance amplifier with LTSpice. I have a current source set to "small signal analysis" with 1mV as the input of the amplifier stage. I run and probe the output but I get 0dB at low frequencies. So I conclude that LTSpice is using the input voltage as reference and not the input current.

I believe I need to explicitly tell LTSpice to plot amplitude and phase of outputVoltage/inputCurrent signals. How can this be done?

If you need more information, please let me know.

Here's a picture of my circuit and resulting analysis. With a resistor of R1=1k I'd expect to get an amplitude of 20log(210mV/210uA) = 60dB at low frequencies. Instead I get 0dB.

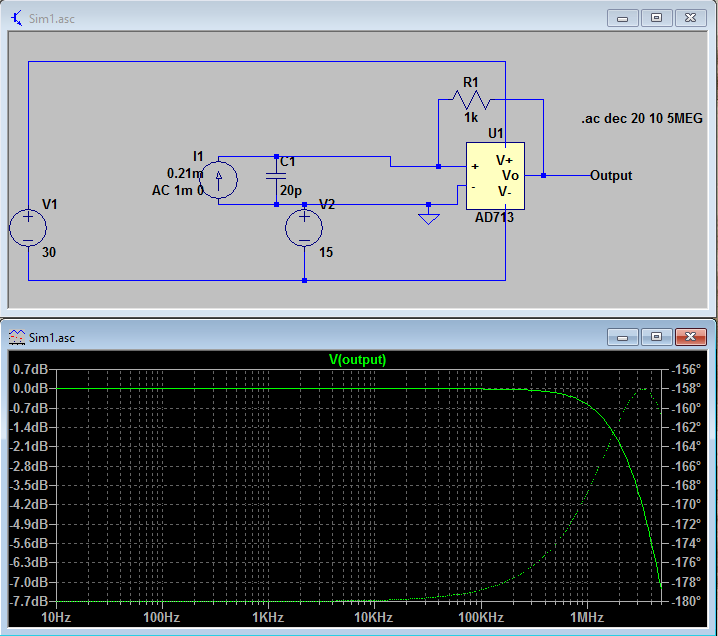
enter image description here

\$\endgroup\$
10
  • \$\begingroup\$ The thing you probe is the same as in transient analysis. So when the pointer is a voltage probe, you probe voltage, if its a current probe you probe current. You can always add manually the thing you want to prove into the plot by its name, and also do calculations there. \$\endgroup\$
    – PlasmaHH
    Commented Jun 21, 2017 at 12:07
  • \$\begingroup\$ Maybe I didn't explain myself properly. The AC analisys presents data in dB, it's a Bode plot. This means it's a relative amplitude given by 20log(Vo/Vi). So it gives you a relative amplitude and phase. What I wan't is 20log(Vo/Ii), which is a transimpedance measurement. Maybe I should add the file I'm using for reference. Let me know. \$\endgroup\$
    – A. Vieira
    Commented Jun 21, 2017 at 12:28
  • 1
    \$\begingroup\$ I think that is what ltspice shows you there, as the AC stimulus is a current. Check the value/plot of the current source, I think you will get a flat -60dB response there \$\endgroup\$
    – PlasmaHH
    Commented Jun 21, 2017 at 12:51
  • \$\begingroup\$ Indeed! A current probe on the output of the current source shows -60dB. So LTSpice is using the output as reference? I should read more on this. Thanks \$\endgroup\$
    – A. Vieira
    Commented Jun 21, 2017 at 13:02
  • 1
    \$\begingroup\$ Afaik it uses 1V as 0dBV \$\endgroup\$
    – PlasmaHH
    Commented Jun 21, 2017 at 13:04

3 Answers 3

1
\$\begingroup\$

Let me point out your main misconception. From there, the answers to your question should be obvious.

In comments you said:

The AC analisys presents data in dB, it's a Bode plot. This means it's a relative amplitude given by 20log(Vo/Vi). So it gives you a relative amplitude and phase.

This is not correct.

When plotting a voltage in dB scale, LTSpice plots in dBV (\$20*\log_{10}\left(\frac{V}{1 \rm V}\right)\$), and when plotting a current on a dB scale it plots dBA (\$20*\log_{10}\left(\frac{I}{1 \rm A}\right)\$).

LTSpice doesn't in general know which source you are considering as the input, so it can't be expected to automatically plot a voltage or current relative to the input voltage or current.

If you want to plot the gain of an amplifier, you can enter formula to be plotted.

Even easier, simply set the AC amplitude of your input source to 1 V or 1 A. Since the SPICE AC analysis is a linearized analysis, this won't cause any problems, even if these amplitudes would cause severe distortion if applied to your real circuit.

\$\endgroup\$
1
  • \$\begingroup\$ Thank you for being rigorous. A few months after I'm still consulting you answer to fix my errors. \$\endgroup\$
    – A. Vieira
    Commented Aug 23, 2017 at 17:28
1
\$\begingroup\$

One milliamp AC input current yields one volt output voltage when the transimpedance amplifier uses a 1K resistor. The output display scale is "dB" relative to one volt. If you change the display units to "linear", you will get a display near one volt. It will actually be very slightly less, since the op-amp hasn't infinite gain.
The output will also contain a DC offset of 0.21 volt as well, but that doesn't display in "AC analysis" plot - only the AC component and phase are displayed.

You could use LTspice's .MEAS statement for gain calculations. Something like:

.meas AC gain MAX V(Output)/I(I1)

In your case, it should give a result near 60 dB, and shows up in the log file:

gain: MAX(v(Output)/i(i1))=(60dB,-6.36019e-005°) FROM 10 TO 5e+006

gives a display of maximum gain, at any frequency in the display. The measurement function is complex, but can do a lot with a plot file.

\$\endgroup\$
1
\$\begingroup\$

As another answer said, you're mostly likely running into the fact that your input source is set for 1 mV amplitude.

There are a number of other reasons why simulators could do poorly in this situation. One is that you may be using a more complicated macromodel of the op-amp which includes limits at the positive and negative supply voltages, and it's possible that you're not currently biased in the middle of the range where you think you are. I would suggest you consider trying a simpler op-amp model and seeing if that works.

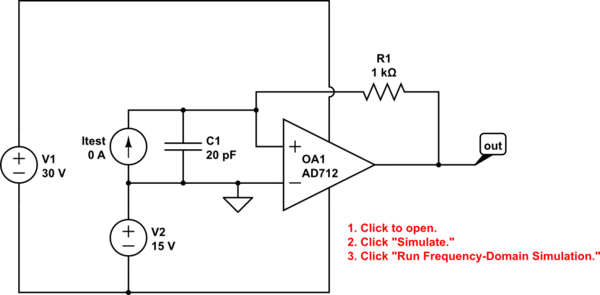
In any case, CircuitLab's simulator gives the right answer immediately:

schematic

simulate this circuit – Schematic created using CircuitLab

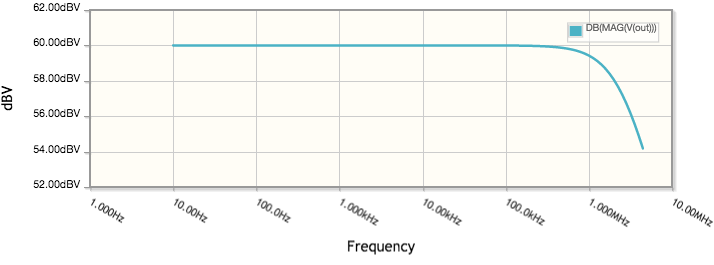
Open the above schematic and run the frequency-domain simulation, which is configured to use Itest as its input signal source. You'll get your expected 60 dB-ohm transimpedance response, which, per the documentation is always a small-signal analysis relative to the input being amplitude 1:

60dB response of transimpedance amplifier

You can also explicitly plot "DB(MAG(V(out)/I(Itest.nB)))" to make the transimpedance relationship more explicit, but you'll get the same Bode plot in the end.

\$\endgroup\$

Your Answer

By clicking “Post Your Answer”, you agree to our terms of service and acknowledge you have read our privacy policy.

Not the answer you're looking for? Browse other questions tagged or ask your own question.