12
\$\begingroup\$

I want to use a practical method/way where I can obtain roughly the Bode plot of a system especially a filter. This of course can be done by using complex math or implementing the circuit in a SPICE simulator. But these requires knowing the circuit diagram and exact parameters of each component.

But imagine we don't know the circuit diagram of a filter in a black box, and we don't have time or possibility to obtain the circuit model as well. Which means we have the filter and we only have access to its inputs and outputs.(I also exclude the idea of obtaining filter's transfer function by applying an impulse to its input, I guess this is impractical(?))

enter image description here

But if we have a two channel oscilloscope and a function generator, we can see the input and output of the filter for a particular sinusoidal input.

By using a function generator, we for example can set the input as a 1Hz sinusoidal with 10mV pk-pk or call it Vin. In this case we can have an output of V1 pk-pk with a phase shift ϕ1. We repeat the same thing by setting the input this time as a 10Hz sinusoidal with again Vin pk-pk. In this case we can have an output of V2 pk-pk with a phase shift ϕ2. So by keeping Vin same amplitude and increasing the frequency equally we can obtain some points as:

Vin f1 ---> V1, f1, ϕ1

Vin f2 ---> V2, f2, ϕ2

Vin f3 ---> V3, f3, ϕ3

...

Vin fn ---> Vn, fn, ϕn

This means we can plot Vn/Vin with respect to fn; and we can also plot ϕn with respect to fn. Thus we might obtain Bode plots roughly.

But this method has some weaknesses. First of all since it will be recorded with pen and paper I cannot increase fn with small intervals. This is too much time taking. Another most important problem here is reading the amplitudes and phase shifts accurately in the oscilloscope screen.

My question is: Assuming we also have a PC based data-acquisition system, is there a practical and faster way to obtain Bode plot points for both amplitude and phase shifts roughly?(Points can be obtained as amplitude and phase shifts or a single complex number as well)

\$\endgroup\$
13
  • \$\begingroup\$ Use a network analyzer, there are models by Keysight, AP instruments, Venable, etc. that will automatically sweep frequency and plot gain/phase or Nyquist plots. You can link these to a PC to automate the process and download the data points. \$\endgroup\$
    – John D
    Commented Nov 15, 2017 at 0:33
  • 1
    \$\begingroup\$ Never used any and I don't have any. They are very expensive. But thanks for mentioning the proper method. \$\endgroup\$
    – user16307
    Commented Nov 15, 2017 at 0:37
  • \$\begingroup\$ I got a working HP 3562A dynamic signal analyzer for $400 on ebay. It's only good to 100kHz, but for my home lab it was good enough. There's also the option to rent an instrument for a short time. You could make your own with a computer-controlled signal generator and data acquisition system, but the time it would take to do it right might make buying an off-the-shelf unit look like a bargain. \$\endgroup\$
    – John D
    Commented Nov 15, 2017 at 0:46
  • \$\begingroup\$ What do you mean by "PC data acquisition system"? A model number would let us know what capabilities you have available. \$\endgroup\$
    – The Photon
    Commented Nov 15, 2017 at 1:02
  • \$\begingroup\$ And what band of frequencies do you think your filter might cover? Answers will be different for 100 Hz and 100 MHz. \$\endgroup\$
    – The Photon
    Commented Nov 15, 2017 at 1:04

8 Answers 8

1
\$\begingroup\$

You can use you DAQ equipment to inject some input signal and then capture the output signal, collect all data in a table/matrix.

The right chapter of signal processing would be the system identification/estimation. Various methods, the recursive least squares is widely used. You would need to inject such signal that isn't repeatable over time, because any algorithm has to distinguish the which part of excitation signal caused which part of the output response. Therefore the excitation signal shall produce a result of one pulse if autocorrelated, this also means that the correlation between input and output signal would give an exact peak (lock in).

Such signal is named PRBS (Pseudo Random Binary Sequence). You can inject this one, then use available system identification tool by calculating (and correlating) system coefficients.

\$\endgroup\$
0
\$\begingroup\$

From what you've said, your best bet might be a time-domain transmission (TDT) measurement.

This is similar to the well-know time-domain reflectometry (TDR) measurement, but you measure the transmission characteristic of the device under test (DUT) instead of the reflection characteristic.

The DAQ system you linked in comments has 50,000 sample per second sampling, but since your frequency band of interest is 0 - 1 kHz, this is adequate for testing your device. You can use a digital output channel (possibly attenuated) to generate the stimulus. The accuracy of the measurement might depend on how consistent the sampling clock of the DAQ is.

Essentially you apply a step input function to the DUT and measure the output with an oscilloscope. Also measure the input signal with the same sampler. Then do a fourier transform on the input and output signals and divide one by the other to get the frequency response. You'll want to study and experiment a bit to choose a good windowing function when doing the transforms.

This technique tends to get less precise at high frequencies because the step function spectrum falls of as \$1/f\$.

\$\endgroup\$
7
  • \$\begingroup\$ Beyond my scope to implement that. But how about if I do this I wrote in quote: "I apply an impulse at input by a function generator and I record the time-domain response of the filter call it h(t) by the dataq device at 12kHz sampling. I then take the Laplace transform of h(t) in MATLAB and obtain H(s). From H(s) I can plot both magnitude and phase responses." Do you think this way makes sense? \$\endgroup\$
    – user16307
    Commented Nov 15, 2017 at 2:08
  • \$\begingroup\$ It depends how good an impulse your function generator is able to produce. For 1 kHz measurement, it's likely to work. You'll still want to measure the input as well as the output to crudely calibrate out any response limitations of your signal source and DAQ. \$\endgroup\$
    – The Photon
    Commented Nov 15, 2017 at 2:10
  • \$\begingroup\$ Min duty cycle of the function generator is 10% So it will not be an impulse but a pulse. Does this kind of step input give some rough result? \$\endgroup\$
    – user16307
    Commented Nov 15, 2017 at 2:12
  • \$\begingroup\$ I'd set it to a very long-period square wave (say 0.1 or 0.01 Hz). Then synchronize the DAQ to capture half a cycle with a rising edge in the middle of the capture interval and no other edges in the capture. The frequency resolution will be related to 1/T where T is the total duration of the capture interval. \$\endgroup\$
    – The Photon
    Commented Nov 15, 2017 at 2:15
  • \$\begingroup\$ How about applying a step input like this one: lpsa.swarthmore.edu/Transient/TransInputs/TransStep/img12.gif And since step input's Laplace is 1/s. And obtaining H(s) = L{f}(s) * s ? (f(t) being the recorded response in time domain) \$\endgroup\$
    – user16307
    Commented Nov 15, 2017 at 2:44
0
\$\begingroup\$

Can your function generator be controlled by a computer? E.g. GPIB

Can your oscilloscope talk to a computer?

If so you can probably automate the existing workflow.

\$\endgroup\$
0
\$\begingroup\$

Well I had a similar problem, how to make a practical usable Bode plotter for closed loop analysis without spending vast amounts of money. I have put together a basic system that covers 10Hz to 50Khz which covers my simple needs, it sweeps in frequency, and plots gain and phase together on a CRT.

It uses two rather obsolete but still useful budget pieces of equipment, and a simple interface between the two. The first item is an HP gain phase meter 3575A which you should be able to pick up for a couple of hundred dollars. This has two identical channels that work from 1Hz to 13Mhz with about +/-50dbdb of dynamic range (200uV to 20V rms dynamic range each channel), and can measure phase continuously over slightly more than 360 degrees. It has digital readout on the front panel with 0.1db and 0.1 degree resolution and dc outputs are available externally at the back. That is my measurement "front end".

The other piece of equipment of about the same vintage is an HP spectrum analyser model 3580A which works from zero to 50Khz and has a tracking generator output. You can pick one of these up for perhaps five hundred dollars if you are lucky. This has one digital memory, so you can store one waveform while measuring another for direct comparison. Is also capable of driving an ancient servo type pen plotter, although I don't use that feature.

Anyhow, the tracking generator output (2v rms) will be the swept frequency source for whatever you are testing. Now the problem is the gain/phase meter puts out a dc voltage, and the spectrum analyser expects to see an ac signal of the exact frequency it is sweeping.

That can be overcome by using an analog multiplier. One multiplier input is driven from the tracking generator. The other multiplier input with the dc voltage from the gain/phase meter after a bit of scaling. The multiplier output goes into the spectrum analyser input.

Dc values from the gain/phase meter control the rf amplitude coming out of the multiplier and hence the amplitude displayed on the spectrum analyser as it sweeps in frequency.

When set for a linear vertical scale (not db) the spectrum analyser will plot either gain versus frequency (in db), or phase versus frequency as a vertical deflection above the baseline. The db to voltage conversion is carried out in the gain/phase meter, the spectrum analyser is run in direct linear mode.

The frequency needs to be swept twice with one trace being stored in memory. Then you hit single sweep again, and get the other signal up on the screen and you can then see both gain and phase together.

The only real limitation is that the frequency scale is linear not logarithmic, but if you are only really interested in perhaps one particular decade, its something you can soon get used to. Do a really broad band sweep first, then do another sweep over the portion of most interest to expanded it out.

For higher resolution of readings of phase, frequency, and gain margins, the HP3580A allows manual frequency tuning, so you just tune for 0db gain, and read the phase straight off the phase meter to 0.1 degree resolution. Then you can manually tune for -180 degrees phase, and read the gain margin from the digital display with 0.1 db resolution, digital frequency readout is to 1Hz resolution.

The trace on the CRT is small, but it does give a very good indication of overall shape, with the usual 10db per division, and 45 degrees per division vertically. And the digital readouts gives all the resolution you could wish for at any specific point of interest on the curves.

Its a real budget system, and a bit Mickey Mouse, but its a very useful tool that allows me to do things I could never have done before. And it was pretty straightforward to put it all together.

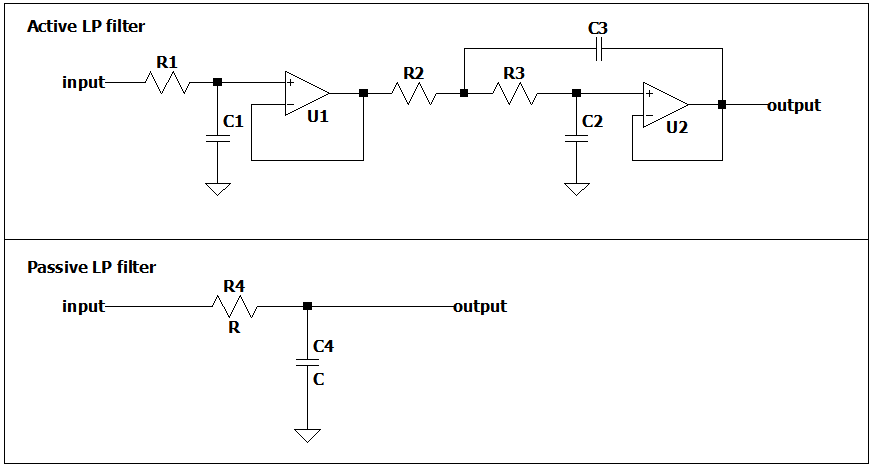
The two input channels on the 3575A gain/phase meter allow closed loop measurements of switching power supplies, and a low frequency 1000:1 current transformer makes a low cost injection transformer from the tracking generator.

I tried several different current transformers before I found one that looked truly flat with only about half a percent drop off at 50Khz.

\$\endgroup\$
0
\$\begingroup\$

What you are looking for is called System Identification. This can be done in numerous ways, but the idea remains the same: Apply an input, measure the response, work the data / math to obtain the transfer function / bode plot. (Simple version: take a fourier transform of the input and output, and divide to get the transfer function)

Usually the problem is what signals are 'allowed' without damaging the 'black box' (the plant). Therefore, measurements can be performed Open loop, or closed loop, and one can play with the input signal.

Most used in control systems is applying white noise (because it contains all frequencies, and is a lot easier to generate than an a perfect impulse or step)

Other possibilites are for example multisine signals, so you can have more control on what kind of signals you apply to the plant.

Try reading up on system identification or play around with Matlab's system identification toolbox.

\$\endgroup\$
0
\$\begingroup\$

While all the previous answers are correct, the method that I am always using is missing: (Vector) Network Analyzer.

It basically carries out what you describe as "tedious" but automatically using EM waves: A swept oscillator generates waves sent through the DUT. It then measures the power being reflected and the power transmitted through the DUT. It gives you the S-parameters. S21 corresponds to the ac transfer function.

In a typical VNA you can set start and stop frequencies, axis scaling (log vs lin), averaging and smoothing for low power levels, real- and imaginary part as well as magnitude and phase.

PS: I just saw that John already listed Network Analyzer as a comment. Did not see that before.

\$\endgroup\$
1
  • \$\begingroup\$ \$S_{21}\$ is related to the AC transfer function, but the two are not strictly equivalent. It depends how your 2-port network is terminated. \$\endgroup\$
    – Shamtam
    Commented Sep 18, 2018 at 20:52
0
\$\begingroup\$

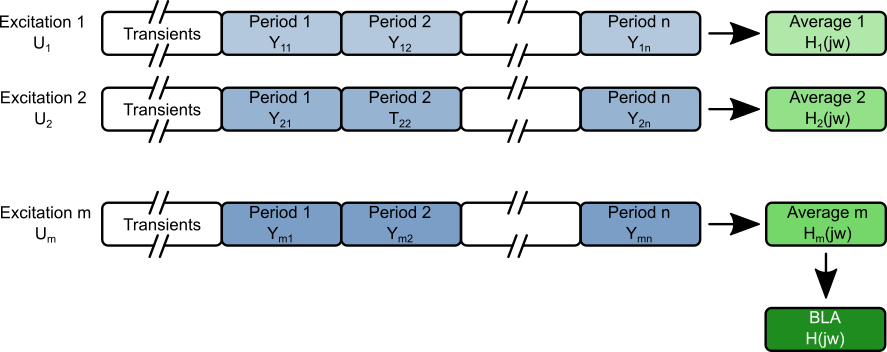
The fastest, most practical and most robust way I know of is by using the Best Linear Approximation (BLA). It is a method that works with linear and nonlinear circuits. The only assumption about the system is:

  • The DUT is "period in same period out". So an output signal with half the frequency won't work.

It works as follows:

  1. You create a setup with the proper anti-alias filters. You preferably sample both inputs \$u(n)\$ and outputs \$y(n)\$.
  2. You construct multiple (\$m\$) random phase multisine excitations. I suggest using an IFFT.
  3. You apply the random excitation to the system.
  4. You can calculate the bode plots for this realization using the Fourier transforms of the measured input and output.

    $$\hat H_i(j\omega) = \frac{\frac{1}{n}\sum_k Y_{ki,meas}(j\omega)}{\frac{1}{n}\sum_k U_{ki,meas}(j\omega)}$$

    Scheme

    (You can also calculate the measurement noise at this point).

  5. Repeat the same experiment for the other excitations. This step is only necessary if you have a nonlinear circuit or if you want to verify how much nonlinear behavior influences the system. Otherwise, you can get everything you want with one excitation (\$m = 1\$).
  6. You can then calculate the best linear approximation:

    $$\hat H_{BLA}(j\omega) = \frac{1}{m}\sum_{i=1}^m \hat H_i(j\omega)$$

Nonlinear behavior will appear as "noise" on the measured spectrums. The only difference is that it is consistent, unlike real noise. This is why multiple excitations are needed to randomize that too. Averaging them will give you the bode plot of a linear system, that will best describe the complete picture.

Note that changing the input power will also change the BLA, a property of nonlinear systems. It is always best to choose an excitation that is similar to the real life application.

\$\endgroup\$
0
\$\begingroup\$

If this is truly a black box, you should not only measure the transfer characteristics of the device, but also measure input and output impedance. You may also need to measure the reverse transfer function. The need for these measurements are dictated by the input and output loads of the devices that are connected to this black box.

\$\endgroup\$

Your Answer

By clicking “Post Your Answer”, you agree to our terms of service and acknowledge you have read our privacy policy.

Not the answer you're looking for? Browse other questions tagged or ask your own question.