0
\$\begingroup\$

I'm trying to refresh my knowledge on RLC filters, and I'm using MATLAB to model it. Given an RLC circuit with the elements in series, taking the output at the capacitor should result in a 2nd-order low pass filter. You can see the circuit I'm trying to replicate here.
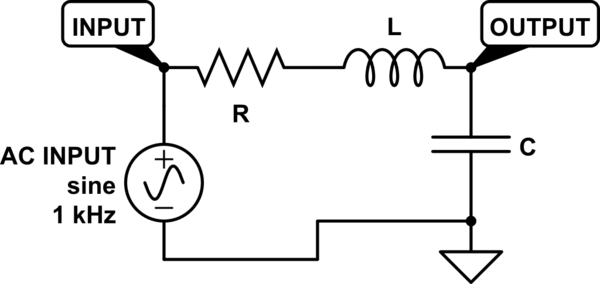
schematic

simulate this circuit – Schematic created using CircuitLab

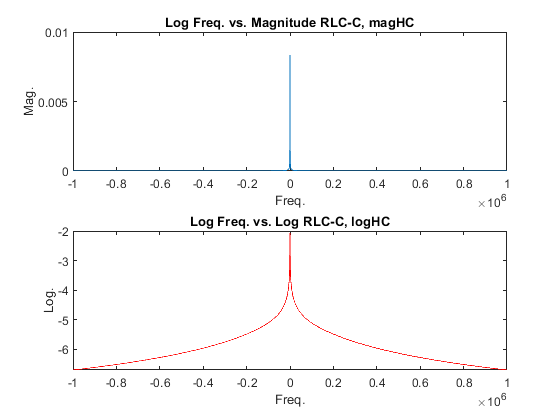
However, the results don't seem to match up with what is expected. I'm using this Filter Design Tool as a check to see if my work matches up with the same values, but the results that I got, when plotted, doesn't make sense. Rather than getting the low pass filter, I seem to have gotten a Notch Filter, which doesn't make sense. I'm sure I got my transfer function right, but what in my code is causing this outcome? Could it be my component values are impractical that's causing this?

EDIT: To better show what I'm talking about, I cleaned up my code a bit, and below is an image of what I'm getting for the bode plot with the exact code. As you can see, it is definitely not a low pass filter as what I expected:

RLC Filter Output

clc; clear all; close all; clc;
omega=-1.*(10.^6):100:1.*(10.^6);    log_omega = log10(omega);
%Limits
nzero=zeros(size(omega));

L = 0.005;     R = 1200;      C =  (10.^-3) ;

%Terms    %Solutions
alpha = (R./(2.*L));        omega_z = 1./sqrt(L.*C);
s1 = (-1.*alpha.*alpha) + sqrt((alpha.^2)-(omega_z.^2));
s2 = (-1.*alpha.*alpha) - sqrt((alpha.^2)-(omega_z.^2));
f1 = s1./(2.*pi);    f2 = s2./(2.*pi);

%Denominator Impedances
ZR = R;
ZL = j.*omega.*L;
ZC = 1./(j.*omega.*C);
denom = ZR + ZL + ZC;

%Function
HC = (ZC)./ denom;    
magHC=abs(HC);    
logHC=log10(magHC);

subplot(2,1,1);
plot(omega,magHC);title('Log Freq. vs. Magnitude RLC-C, magHC');
xlabel('Freq.'); ylabel('Mag.');      hold on;

subplot(2,1,2);
plot(omega,logHC,'r');
title('Log Freq. vs. Log RLC-C, logHC'); xlabel('Freq.'); ylabel('Log.');
hold on;   
\$\endgroup\$
3
  • 1
    \$\begingroup\$ Did you really mean to use a 5000H inductor and a 1mF capacitor? \$\endgroup\$ Commented Feb 13, 2019 at 17:51
  • 1
    \$\begingroup\$ Also, if I understand correctly, you are taking the voltage across the resistor as the output voltage (H = ZR./(ZR+ZL+ZC)) and in that case some sort of resonant behavior seems reasonable. \$\endgroup\$ Commented Feb 13, 2019 at 17:53
  • \$\begingroup\$ @ElliotAlderson Sorry about that. Using ZR instead of ZC was a typo. Changing the numerator to ZC yielded a notch-filter. For my component values, I thought that originally their values were too small to see any effect, so I thought to increase them to large values in order to get a response. Sadly, it didn't have the effect that I had intended. I know that the values are impractical, but I'm really just trying to see the effects of an RLC filter circuit, and right now, first step is trying to get some expected results. \$\endgroup\$ Commented Feb 13, 2019 at 18:25

1 Answer 1

2
\$\begingroup\$

It is much easier to work in the s-domain and let Matlab do most of the work for you. See sample code:

L = 5000;     R = 1200;      C =  (10.^-3) ;

ZR = tf(R, 1);
ZL = tf([L 0],1);
ZC = tf(1,[C 0]);

H = ZC/(ZR+ZL+ZC);

bode(H)

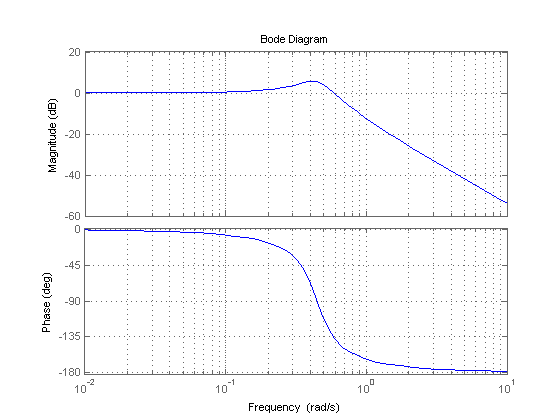
Which yields the following bode plot:

enter image description here


EDIT:

I can't comment on the utility of negative frequencies, however your vector omega misses all of the interesting frequencies with respect to the filter.

Use the following span of test frequencies to repreduce a similar plot to Matlab's builtin in bode plot:

omega=logspace(-2,1,31);

A bode plot typically a log-log plot (y-axis is log due to use of dB).

\$\endgroup\$
3
  • \$\begingroup\$ Thanks for your reply. I see how using the 'tf' function makes things easier, but mathematically, shouldn't my values for impedance (ZL, ZC, ZR) also work? Writing them out like that worked when demoing an RL and RC first order high/low pass filter, but what makes it impractical here? \$\endgroup\$ Commented Feb 13, 2019 at 18:29
  • \$\begingroup\$ Yes you can proceed that way, though I'm sure what your are expecting the negative frequency response to be. The bode plot above is for omega>=0, and R is lowered by a factory of 10 to show peaking in the filter. \$\endgroup\$
    – sstobbe
    Commented Feb 13, 2019 at 18:44
  • \$\begingroup\$ Thanks again for your reply. The thing is though, wouldn't the negative frequency response be shown in the negative spectrum? I ran the same numbers you had for L, R, and C, and my graph definitely did not look like what you had. In my code, I had values of omega range from -1*10^6 to 1*10^6, so I don't think it's a problem there. \$\endgroup\$ Commented Feb 13, 2019 at 21:57

Your Answer

By clicking “Post Your Answer”, you agree to our terms of service and acknowledge you have read our privacy policy.

Not the answer you're looking for? Browse other questions tagged or ask your own question.