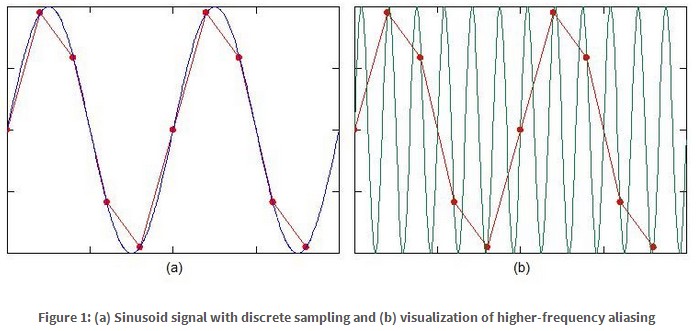
The plots below (taken from here) show why calculating ADC 'bandwidth' from peak sample values may be problematic.

The plot on the right shows what happens when the sampling frequency is below the input frequency. The signal has aliased down to a lower frequency inside the Nyquist limit, and there is no way to tell what the actual input frequency was. Despite this, the ADC is still producing the same peak amplitude for a frequency way above its 'bandwidth'.
Note also that while the peak amplitudes are identical, neither of them actually reach the peak amplitude of the input signal. This may be a problem because the sampling points depend on the relative phase of the input and sampling frequencies. At certain frequencies and phases there will be 'nulls' of lower peak amplitude, going down to zero amplitude when the sampling rate exactly equals the input frequency. However, provided the input frequency and sampling rate are not locked in phase you will (eventually) see the true peak values.
When I find the -3dB point, what is the corresponding official
bandwidth I've found? Is it fin or fin/2 with consideration of the
Nyquist rate?
I'm not sure that an 'official' Nyquist related bandwidth exists, but if it did I imagine it would be based on the rms level of many samples with random phases, not the peak sample values. Usually the aliased output above half the sampling rate is considered to be anomalous, so the first dip to -3dB below that (if it existed) would be considered the bandwidth.
You may not detect any dip in peak values due to the sampling rate, but you should see any attenuation in the analog circuitry before or inside the ADC (antialiasing filter, sample-and-hold circuit etc.). Depending on the sample rate applied, that analog bandwidth may be much higher than the Nyquist frequency or sampling rate.

