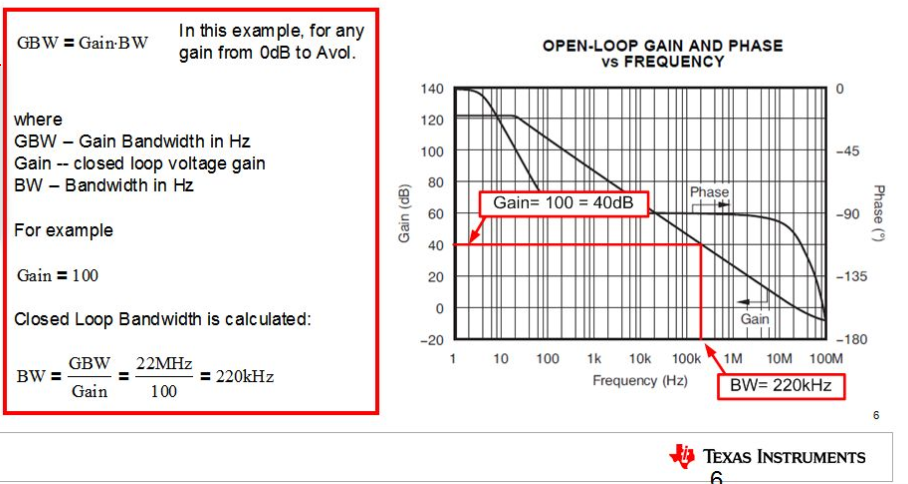
The DC low pass filter with a breakpoint of 20 Hz and a gain of 120 dB is no accident. This is performed by an small integrating capacitor in the intermediate stages of the Op Amp.
By swamping (shunting) the gain of the amplifiers well below what they are capable of, means that the frequency limitations of each transistor stage are replaced with an ideal amplifier and an integrator. First order filters are much easier to deal with in closed loop designs than higher order feedback with issues with instability, oscillations, ringing, overshoot.
So essentially the bandwidth limitations of each transistor stage are ignored. Thus a high order, high phase-shift effect at unity gain is converted from an nth order filter to a first order low pass filter with -90 phase shift up to unity gain where it might be starting to see the residual phase shift and gain of the internal transistors so -100' phase shift with 180 deg inverting feedback means you would expect a 180-100 = 80 deg. phase margin at unity gain. I recall 60 deg. is often considered adequate for Phase margin in a closed loop design, unless you really need zero overshoot on a step pulse.
Thus the reason we use the Bode plot to read phase margin, is because it is necessary to have less than 180 phase shift for intended negative feedback gain control with impedance ratios and always converting to 1st order integrator works easiest. But for "video amps" that need high gain, this method is not used.
Now the Bode GBW is just a linear 1st order product of the integrator of 20dB/decade or 10x per decade = Gain * BW= GBW
added
As I see I get the bandwidth when open-loop gain = 40dB !?!?
Yes. The Open Loop gain, Aol at 220 kHz is 100 or 40 dB and if you choose a gain using Rf/Rin=100 then the -3dB BW is also 220 kHz so the actual gain is 37 dB , the half power point.
What is nice about Log-Log graphs here is that a straight line can represent of Gain vs BW instead of an inverse hyperbolic line on a linear scale. Thus a product or a ratio displays this easily like a slide rule used to for computing ratios or products of 2 numbers, Gain and Bandwidth. Since the LPF attenuates at 20 dB/decade for a 1st order filter, the result is this linear slope on a log-log scale.
So the Bode Plot shows your Op Amp linear R ratio for fixed gain up to the point where the open loop gain intersects with the planned fixed gain.

