3
\$\begingroup\$

I have a lists of current and voltage of one device and I would like to calculate the resistance. There are some errors with the coordinate, so I have made a script where I calculate the line by linear regression.

from scipy.stats import linregress
import matplotlib.pyplot as plt
import numpy as np
import pandas as pd

voltage = np.array([1, 2, 3, 4, 5, 6, 7, 8, 9, 10])
current = np.array([3, 6, 6, 10, 9, 15, 14, 16, 20, 25])
slope, intercept, r_value, p_value, std_err = linregress(voltage, current)
print(linregress(voltage, current))

plt.plot(voltage, current, 'o', label='original data')
plt.plot(voltage, intercept + slope * voltage, 'r', label='fitted line')
plt.xlabel('Voltage')
plt.ylabel('Current')
plt.show()

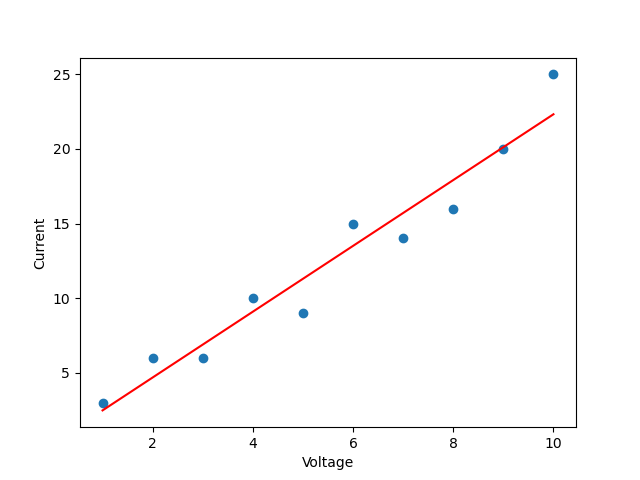
Which plots me: enter image description here

and prints:

LinregressResult(slope=2.206060606060606, intercept=0.2666666666666675, rvalue=0.9703665463597563, pvalue=3.2552108142876276e-06, stderr=0.1942232770783282, intercept_stderr=1.2051237414984548)

What is the value of the resistance for this device, how to calculate it from line?

\$\endgroup\$
1
  • 1
    \$\begingroup\$ If your "device" is not an ideal resistor then the notion of calculating its resistance is not valid. \$\endgroup\$ Commented Nov 3, 2021 at 19:11

4 Answers 4

3
\$\begingroup\$

Look at Ohm's law for resistors:

V = I x R

Then solve it for R:

R = V/I

Looking at your graph, the slope of the line is I/V, which is the reciprocal of R.

So R = 1/m

Where m is the slope of your graph.

\$\endgroup\$
3
\$\begingroup\$

Ohms law tells us \$V=IR\$, so \$R=\frac{V}{I}\$, so \$\frac{1}{\text{slope}}\$ is your resistance.

I suspect your current number are actually milliamps and not amps, so you need to correct for that.

A more meaningful way to do this is to force your line fit to have a zero intercept.

\$\endgroup\$
1
  • \$\begingroup\$ Thank You for helpful answer! It is on point, however mkeith was slightly faster so I decided to accept his answer. \$\endgroup\$
    – Jerzy
    Commented Nov 4, 2021 at 10:25
3
\$\begingroup\$

First make sure both units have the same magnitude (V and A, mV and mA etc).

Second, if you force the intercept to zero and switch V with A, so the slope is directly the resistance, the code becomes simply:

import numpy as np

voltage = np.array([1, 2, 3, 4, 5, 6, 7, 8, 9, 10])
current = np.array([3, 6, 6, 10, 9, 15, 14, 16, 20, 25])
resistance = np.sum(voltage*current)/np.sum(current**2)
print(resistance)
\$\endgroup\$
0
\$\begingroup\$

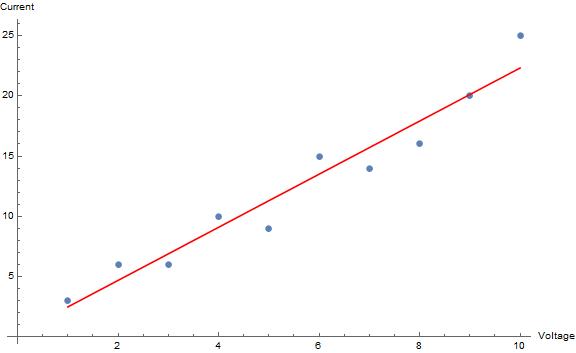
Using Mathematica I make the following picture:

enter image description here

The equation of the line of found using the least square method and is given by:

$$\text{Current}\left(\text{Voltage}\right)=\frac{364}{165}\cdot\text{Voltage}+\frac{4}{15}\tag1$$

We know Ohm's law:

$$\text{R}\space\left[\Omega\right]=\frac{\text{V}\space\left[\text{Volt}\right]}{\text{I}\space\left[\text{Ampere}\right]}\tag2$$

So, we can write:

$$\text{R}=\frac{1}{\text{Current}'\left(\text{Voltage}\right)}=\left(\frac{\text{d}\text{Current}\left(\text{Voltage}\right)}{\text{dVoltage}}\right)^{-1}=\frac{165}{364}\approx0.453297\space\Omega\tag3$$


The Mathematica-code I just is:

y = Fit[{{1, 3}, {2, 6}, {3, 6}, {4, 10}, {5, 9}, {6, 15}, {7, 
     14}, {8, 16}, {9, 20}, {10, 25}}, {1, x}, x];
Show[ListPlot[{{1, 3}, {2, 6}, {3, 6}, {4, 10}, {5, 9}, {6, 15}, {7, 
    14}, {8, 16}, {9, 20}, {10, 25}}], 
 Plot[y, {x, 1, 10}, PlotStyle -> Red], 
 AxesLabel -> {HoldForm[Voltage], HoldForm[Current]}, 
 PlotLabel -> None, LabelStyle -> {GrayLevel[0]}, ImageSize -> Large]
\$\endgroup\$

Your Answer

By clicking “Post Your Answer”, you agree to our terms of service and acknowledge you have read our privacy policy.

Not the answer you're looking for? Browse other questions tagged or ask your own question.