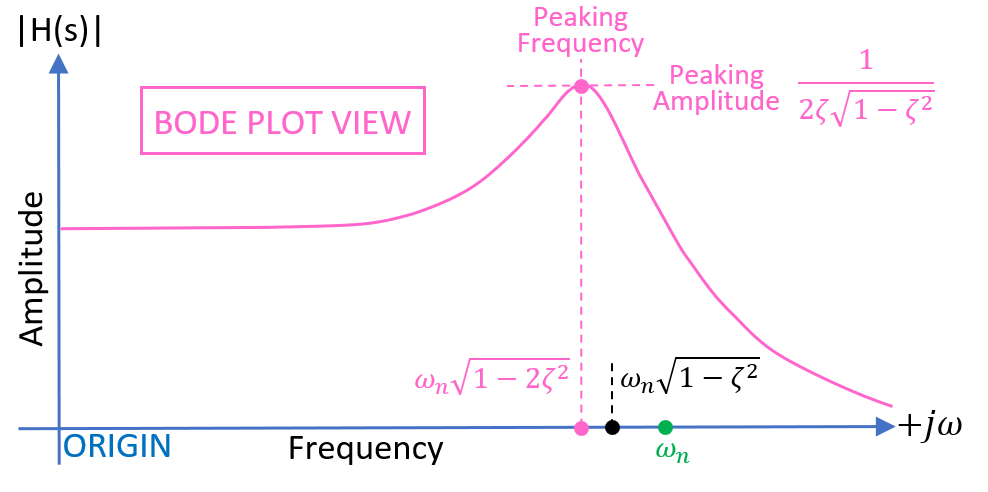
For a 2nd-order low-pass filter you can use this to calculate what the damping ratio, (\$\zeta\$) is: -
 Image from my basic website.
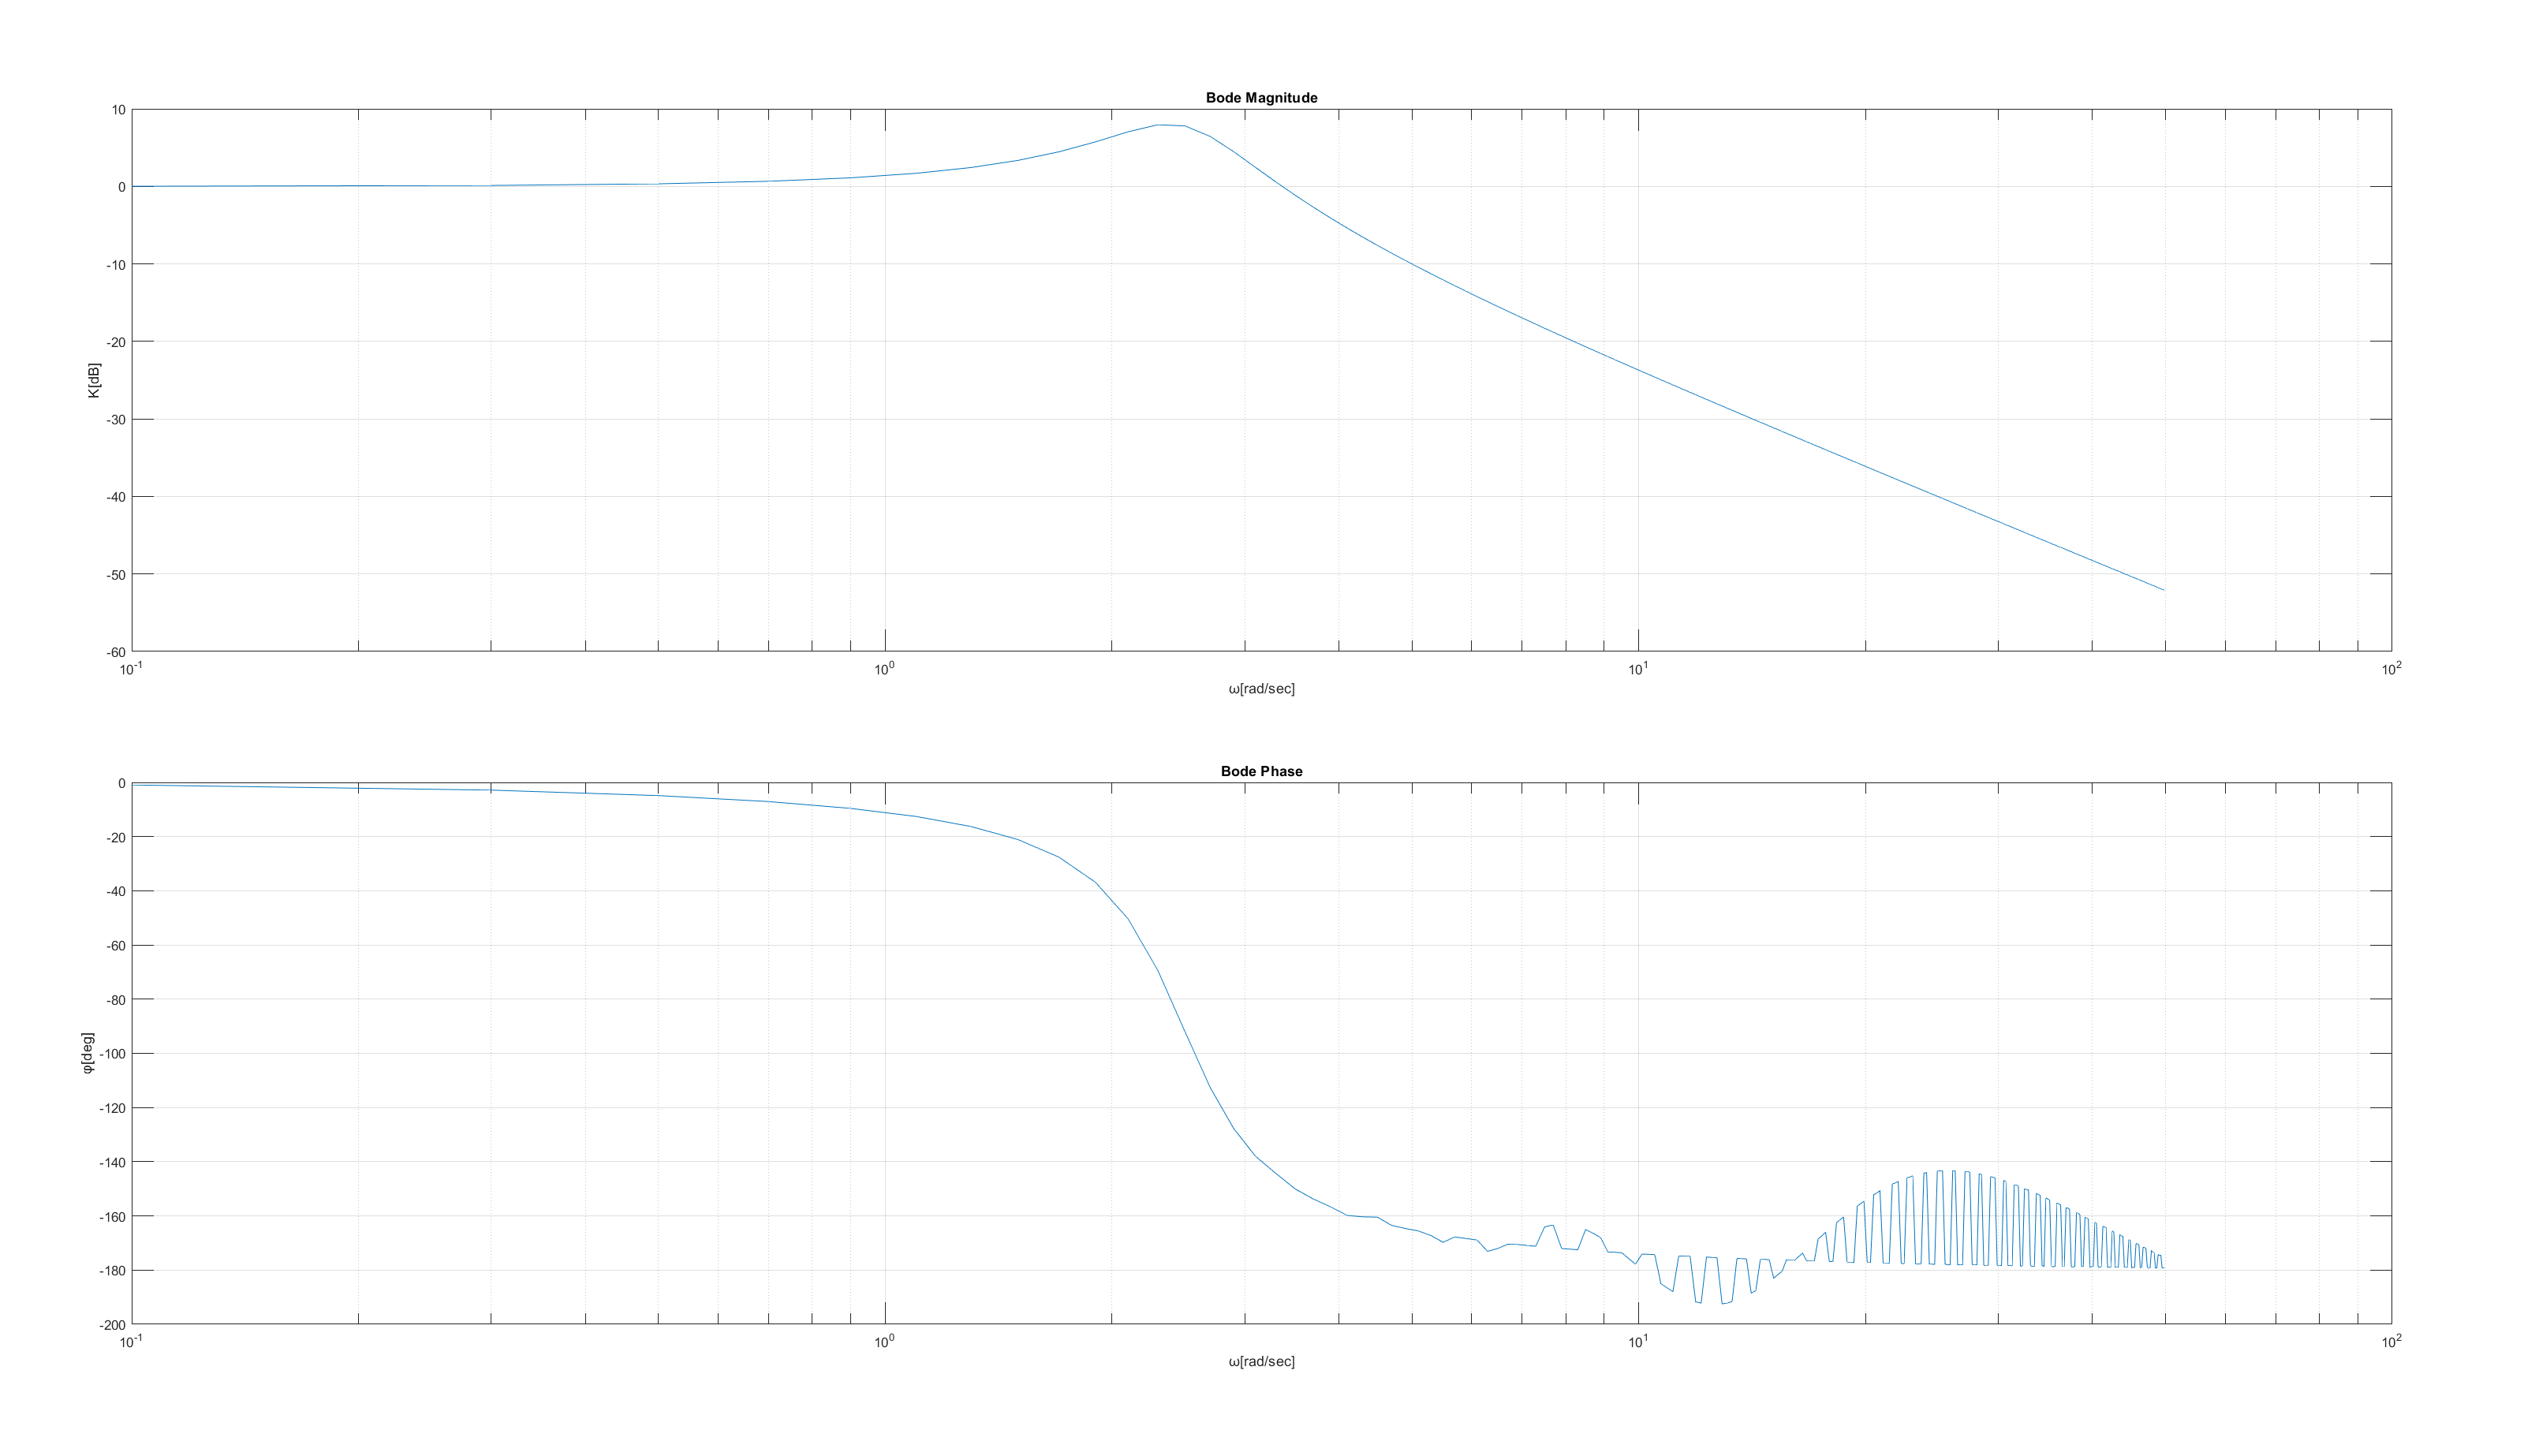
Look at the peaking frequency in your spectrum and calculate the damping ratio from that. It looks like "k" the gain coefficient is unity (because of the low frequency gain aligning with 0 dB on your picture) so this needn't play a part anymore.
Once you have the damping ratio you can calculate what \$\omega_n\$ (also referred to as \$\omega_0\$) is.
It looks like you have about 8 dB of peaking. That's a ratio of 2.512. So solve the peaking amplitude formula to find \$\zeta\$. I estimate \$\zeta\$ to be about 0.2050.
I estimate the peak position in the spectrum to be at about 0.957053 of the natural resonant frequency, \$\omega_n\$.
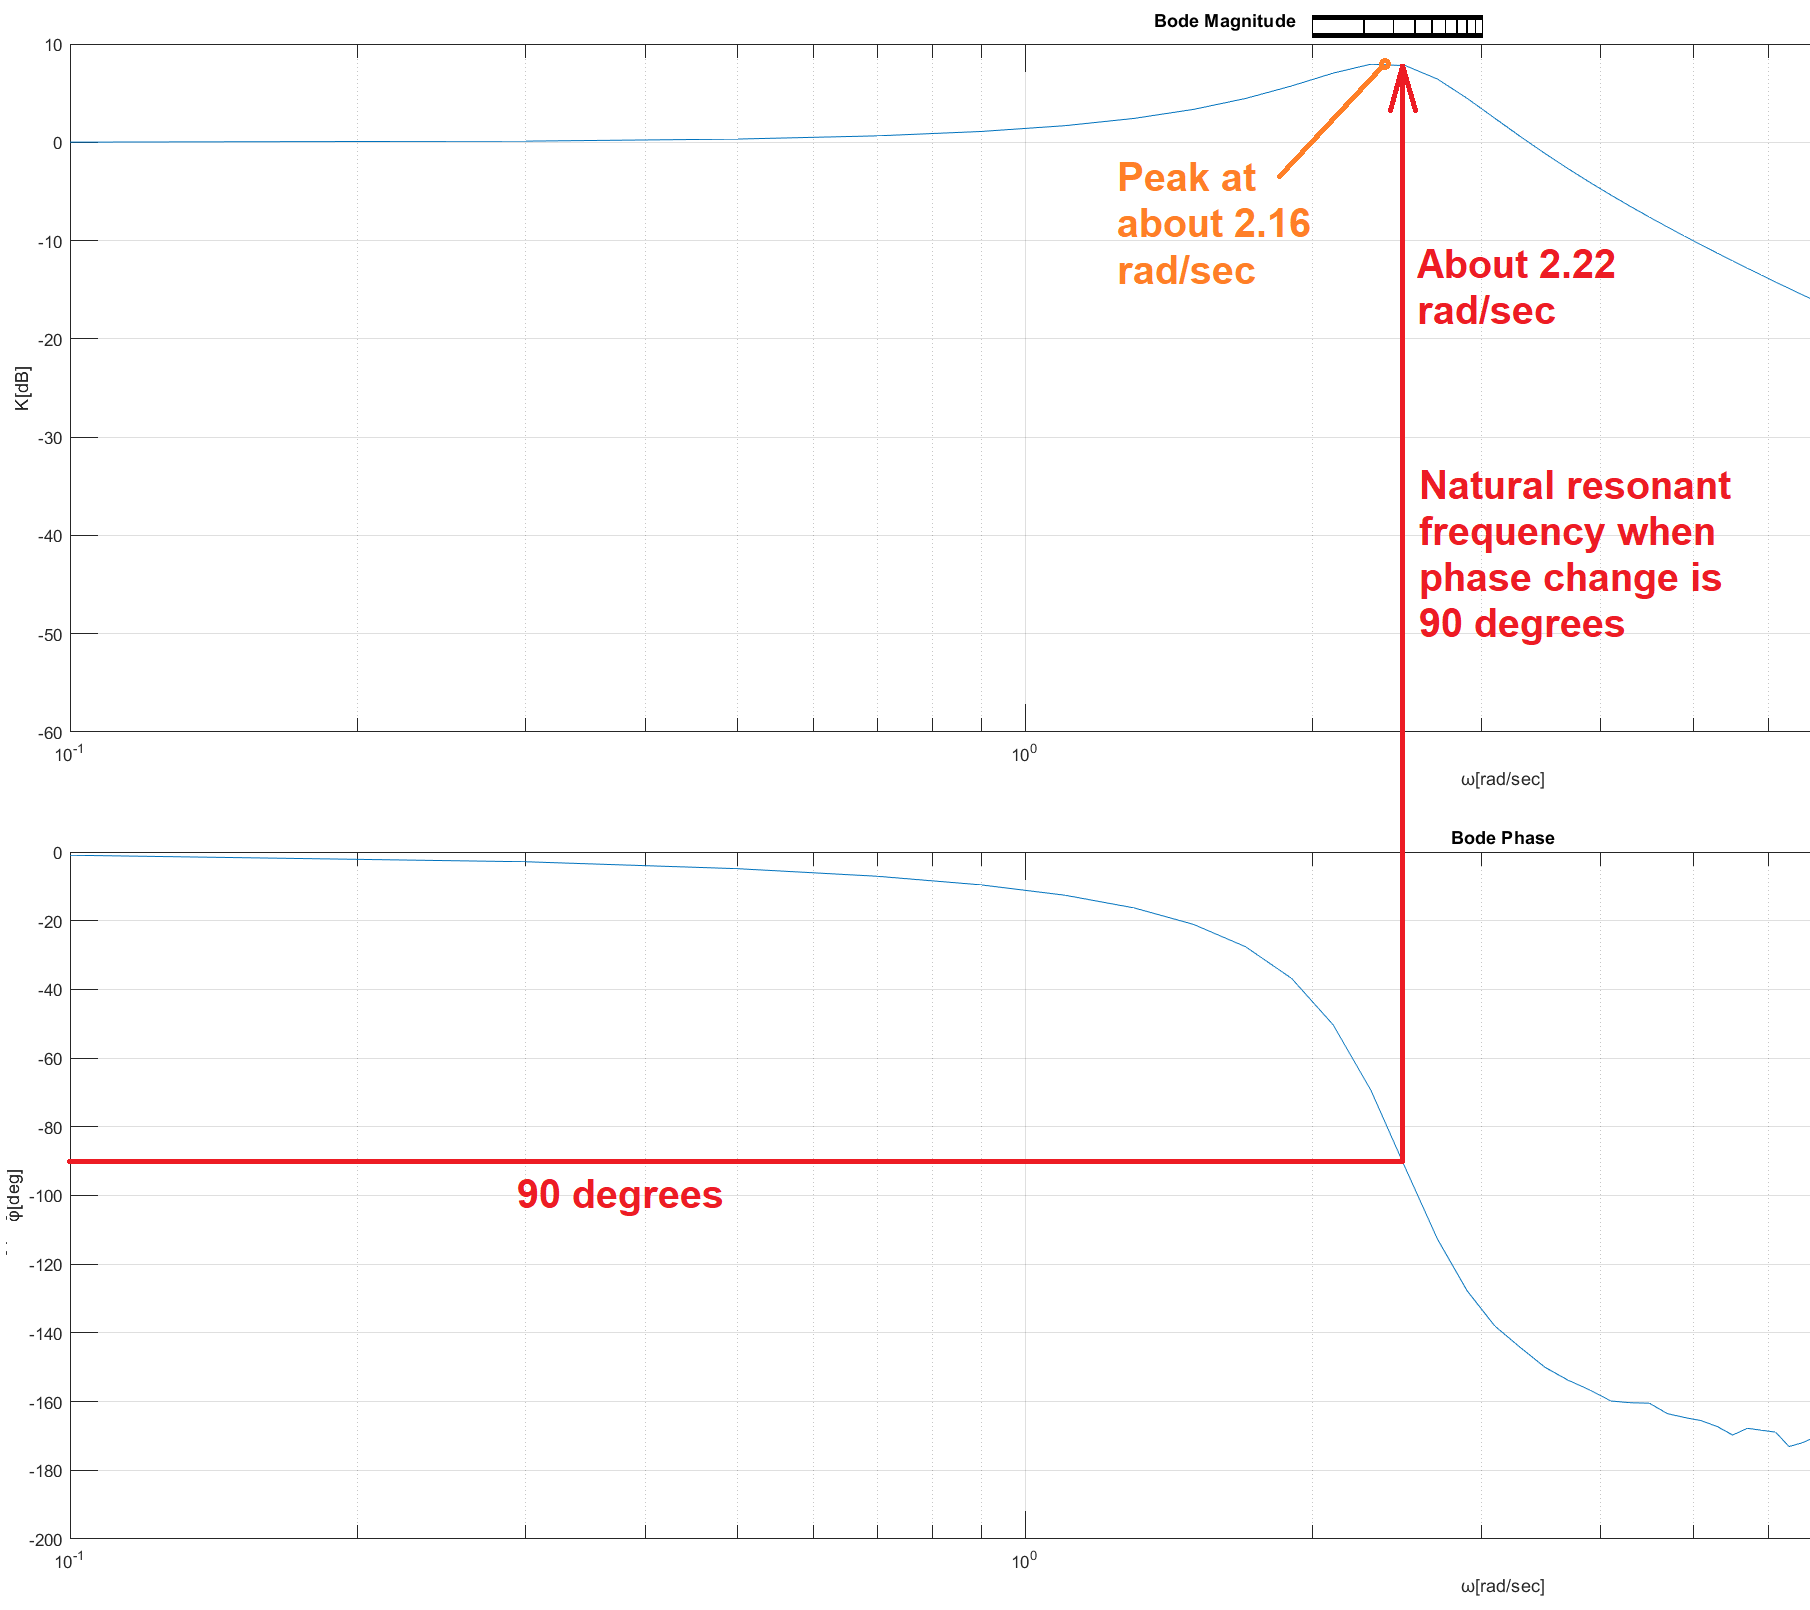
Of course you could work a little bit on the graph to find the same answers: -


