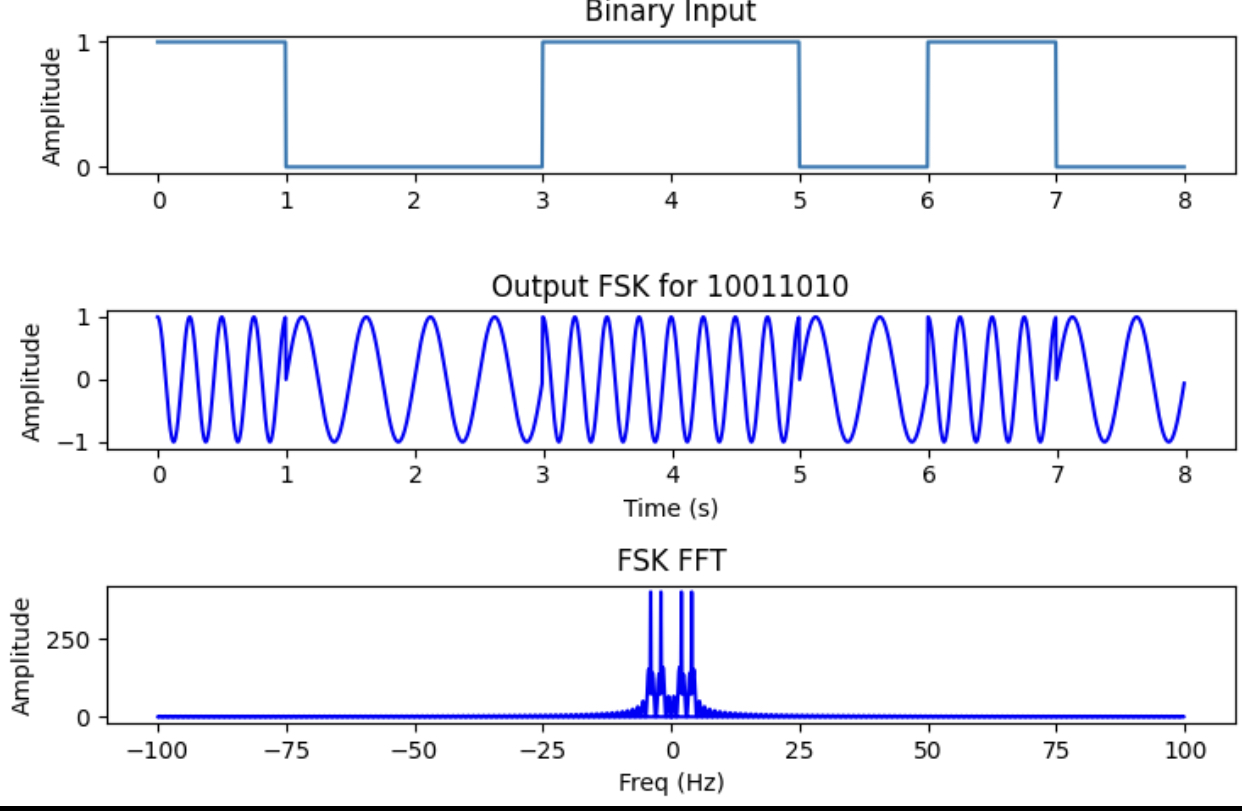
I am currently writing a script that uses I/Q data to do FSK modulation.
My question is about the FFT plot. I expected to have a peak at 1Hz and 2Hz which are the frequencies that represent binary 0 and 1, however I have peaks at 2 and 4Hz.
I initially suspected that I was using the FFT freq function incorrectly however I set the bin size equal to the number of samples and also defined my sample freq.
Any idea why my FFT frequencies are off?
Thanks in advance
import numpy as np
import matplotlib.pyplot as plt
from scipy.fftpack import fft

binary_in = "10011010" # binary input string

sr = 200  # sampling rate
ts = 1.0/sr # sampling interval
time = (np.arange(0,len(binary_in)*1,ts))-ts  # time for plotting entire FSK signal
step = int((len(time))/(len(binary_in)))  # temporal step size for FSK signal relating to each bit
T = np.arange(0,step/100,0.01) # time for calculating sinusoids

f1 = 1  # frequency for binary 0
f2 = 2 # frequency for binary 1

coeff = 2*np.pi

## I and Q defined to have freq of (f1-f2)/2
I = np.cos(coeff*((f1-f2)/2)*T)
Q = np.sin(coeff*((f1-f2)/2)*T)

## In the case of a binary 1 I and Q would be mixed with the LO freq in the following way:
mixer1 = I*np.cos(coeff*((f1+f2)/2)*T)
mixer2 = Q*np.sin(coeff*((f1+f2)/2)*T)

out1 = mixer1+mixer2   #Output is added to give a FSK signal equal to approx. cos(-f2*t)

## In the case of a binary 1 I and Q would be mixed with the LO freq in the following way:
mixer3 = Q*np.cos(coeff*((f1+f2)/2)*T)
mixer4 = I*np.sin(coeff*((f1+f2)/2)*T)

out2 = mixer3+mixer4  #Approx. sin(f1*t)

final_fsk = []
bin_plot = []

ones = [1] * step
zeros = [0] * step

j=0 # index for assigning FSK signal to plotted output list


## Assign correct output freq. based on binary input
for i in range(0, len(binary_in)):
    j=j+1
    if binary_in[i] == "1":
        final_fsk[(j*step-(step-1)):(j*step)] = out1
        bin_plot[(j*step-(step-1)):(j*step)] = ones
    else:
        final_fsk[(j*step-(step-1)):(j*step)] = out2
        bin_plot[(j*step-(step-1)):(j*step)] = zeros


fourier = np.fft.fft(final_fsk)
freq=np.fft.fftfreq(len(final_fsk),ts)
# n = np.arange(0, len(fourier))
# period = len(fourier)/sr
# freq = n/period


plt.subplot(311)
plt.title("Binary Input")
plt.plot(np.arange(0, (len(binary_in)),ts), bin_plot)
plt.ylabel('Amplitude')

plt.subplot(312)
plt.title(f"Output FSK for {binary_in}")
plt.plot(time, final_fsk, 'b')
plt.ylabel('Amplitude')
plt.xlabel('Time (s)')

plt.subplot(313)
plt.title("FSK FFT")
plt.plot(freq, np.abs(fourier), 'b')
plt.ylabel('Amplitude')
plt.xlabel('Freq (Hz)')

plt.tight_layout(pad=1)
plt.show()

