As you know, the power being dissipated by any component is the product of the current through it and the voltage across it:
$$ P = I \times V $$
This is trivial to evaluate if both current and voltage are constant, but in most cases we do not have that luxury. In reality they both change over time. In other words, they are functions of time:
$$ P(t) = I(t) \times V(t) $$
This says that the power being dissipated in the component at some instant t in time is equal to the product of current and voltage at that instant. Being functions of time implies that either current or voltage (or both) can change as time passes, and consequently so will power, and whatever "instantaneous" power you calculate (or measure) at time t will not necessarily have the same value as it had one hour before, or will have one nanosecond after. The key concept here is the "instantaneous value", calculated/measured for a single instant in time.
The variable names \$P\$, \$I\$ and \$V\$ are capitals, which is often used to imply some constant value, or some instantaneous value at time t. Lower case names \$p\$, \$i\$ and \$v\$ often signify a value that changes over time. Strictly speaking they should be written in their full form \$p(t)\$, \$i(t)\$ and \$v(t)\$, but they are often abbreviated to just \$p\$, \$i\$ and \$v\$, the \$(t)\$ part being implied.
Note: There is a special case where \$i\$ and \$v\$ (lowercase) are used to indicate amplitudes, and not functions of time. That case is when the signals are sinusoidal, not the case here.
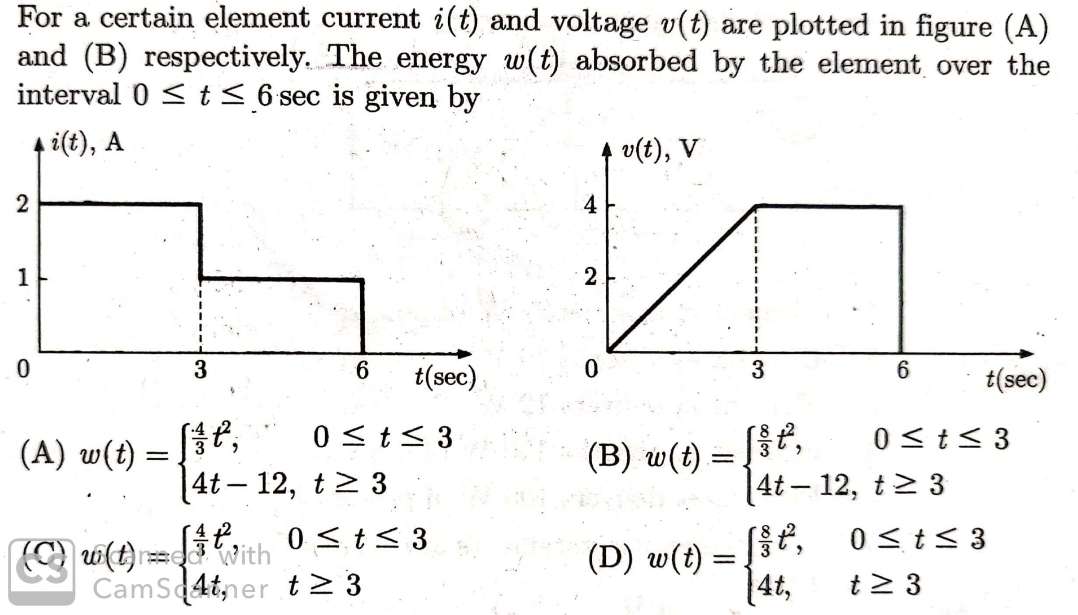
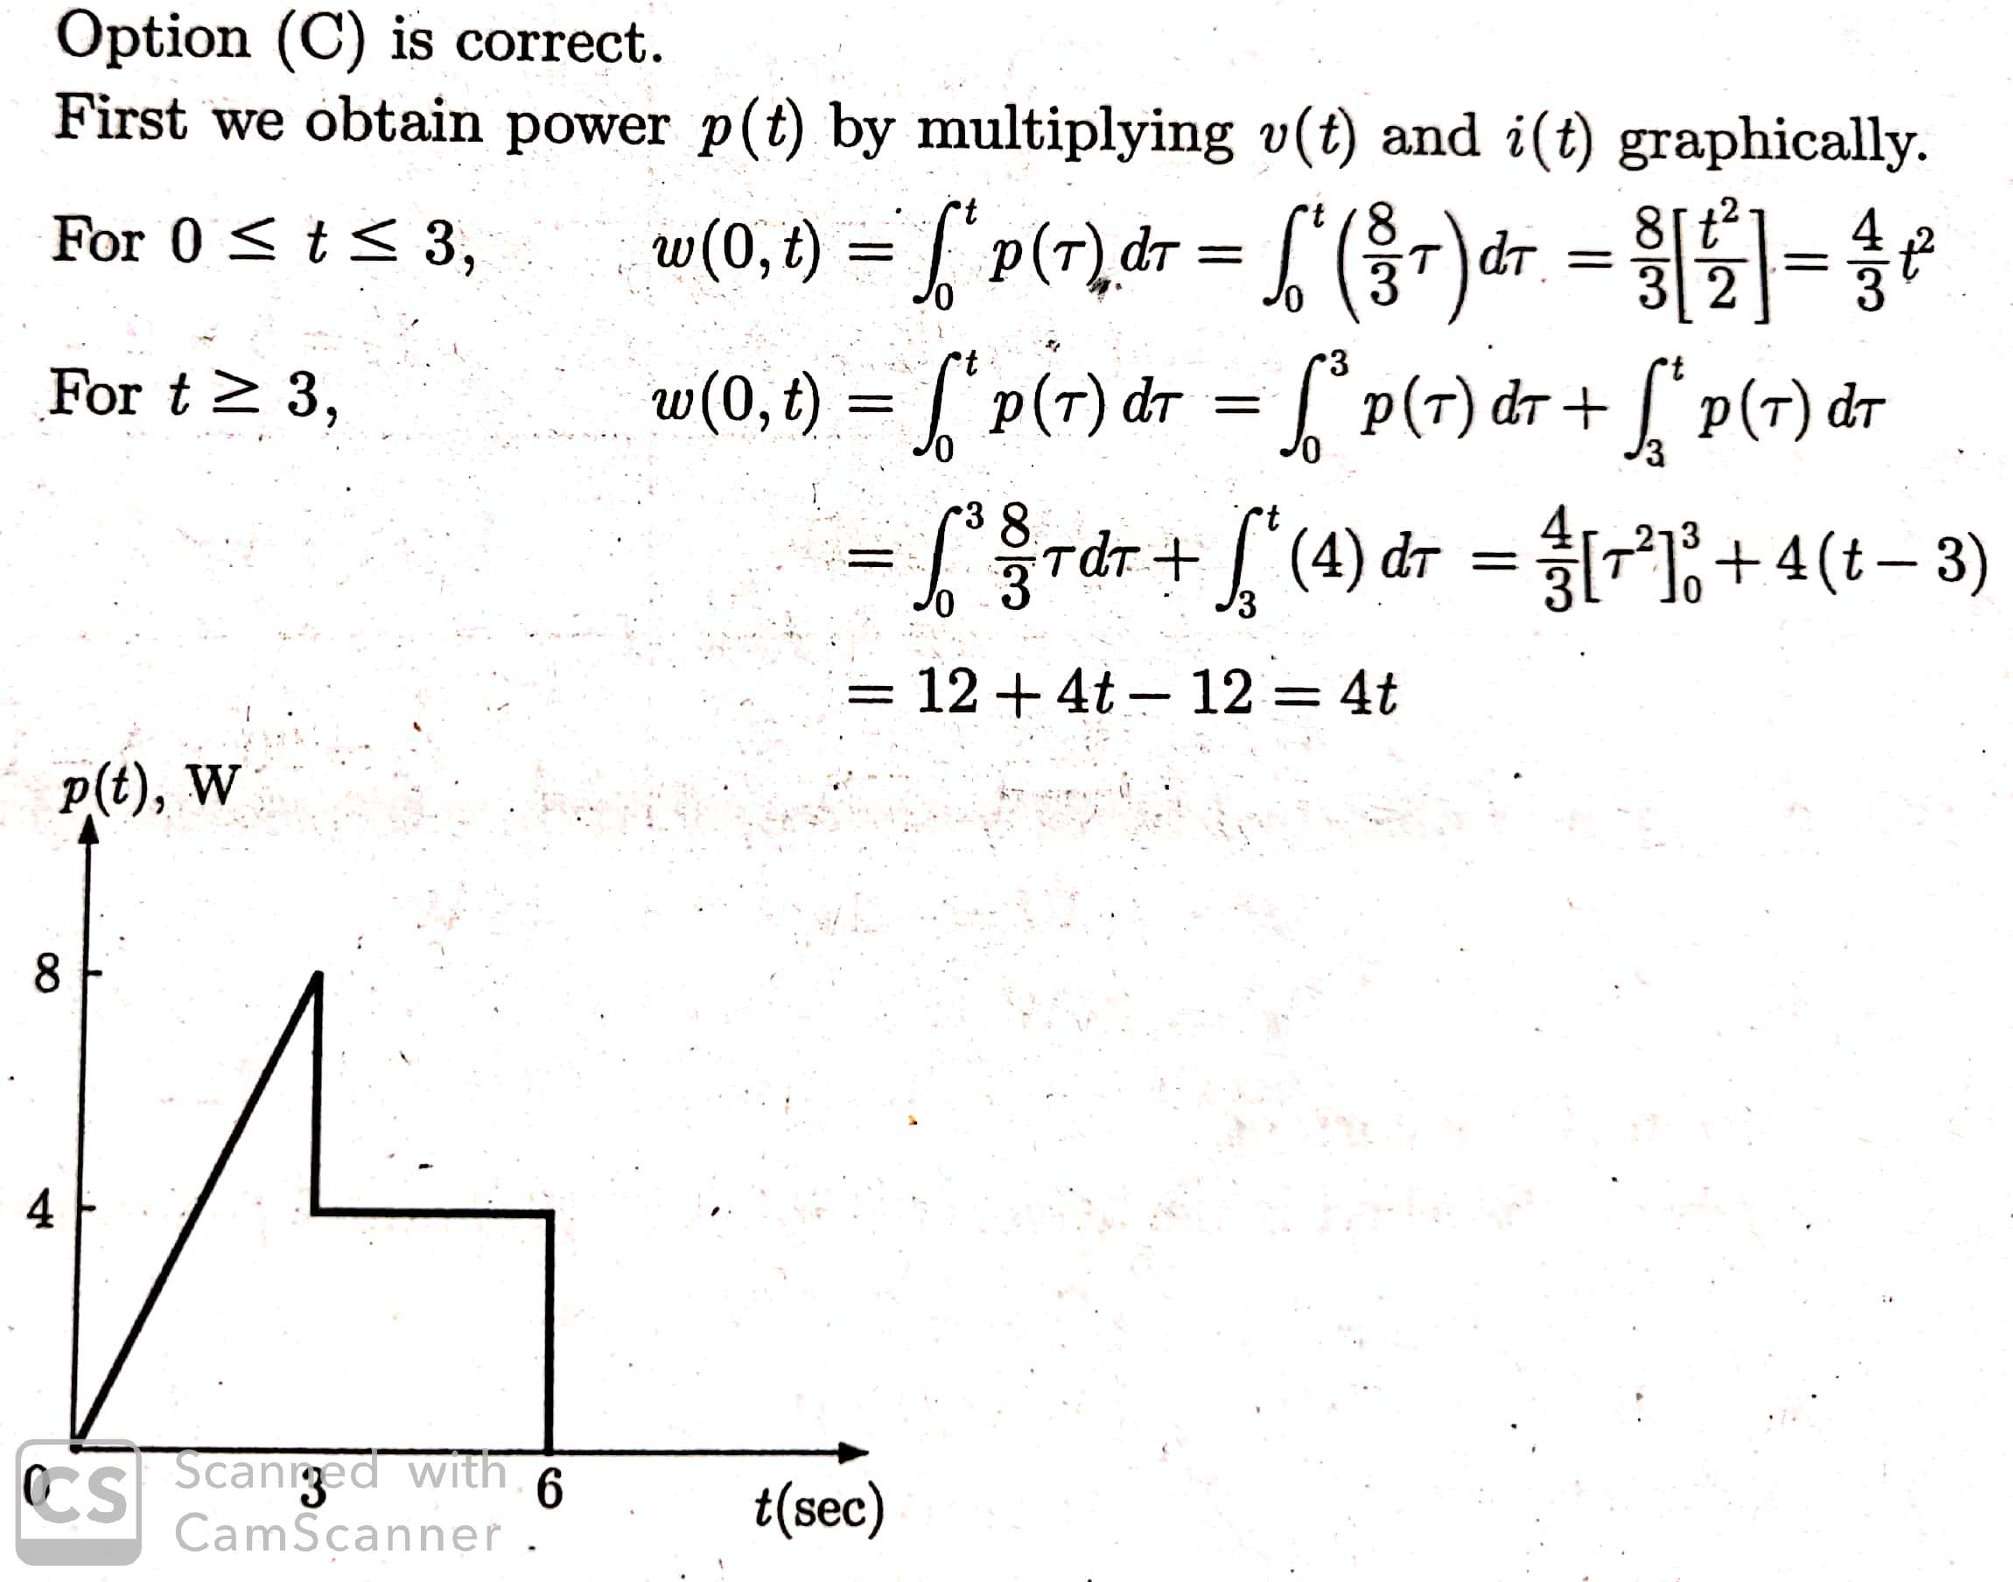
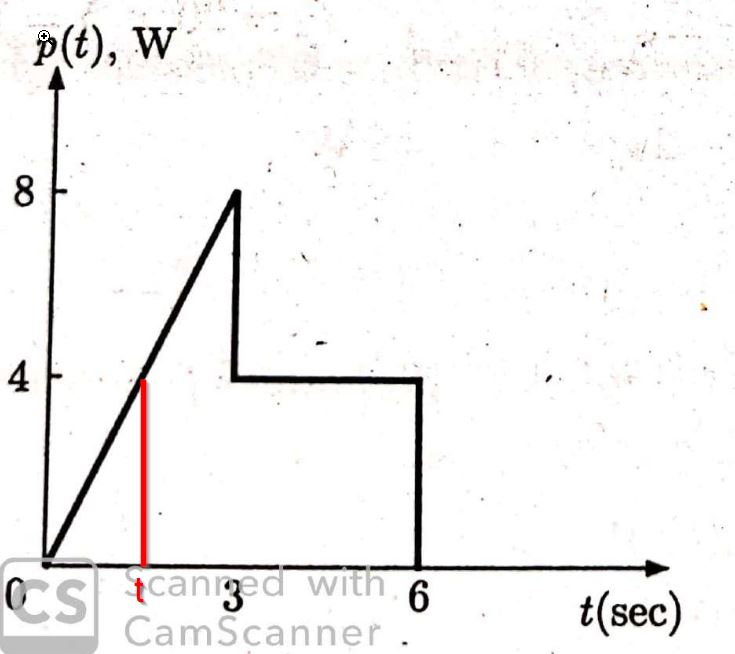
The first two graphs you gave us are showing how \$i\$ (through some component) and \$v\$ (across that component) vary with time \$t\$. The third graph shows us \$p\$, simply the product of \$i\$ and \$v\$, which, of course, represents power. Thus the third graph shows you the power being dissipated in the component at any given instant in time.
You construct this graph of power vs. time by multiplying \$i\$ and \$v\$ at each instant (some value of \$t\$). In this case, the graph of power is quite trivial to construct, since the graphs \$i(t)\$ and \$v(t)\$ are clearly divided into two distinct intervals. Between instants \$t=0\$ and \$t=3s\$, \$i\$ remains constant at 2A, and \$v\$ rises linearly from 0V to 4V. During the second interval between times \$t=3\$ and \$t=6s\$, both values remain constant at \$i=1A\$ and \$v=4V\$.
This division into "geometrically primitive" intervals makes it easier to construct the graph of power without actually having to measure \$i\$ and \$v\$ at every single instant in time. I hope it's clear that if one of those two variables remains constant, then their product is simply a scaled version of the other. If both are constant for some duration, then their product is also constant during that period. That's what you are seeing in the third graph you show us, power. The product of \$i\$ and \$v\$ is a value rising linearly from 0 to something for \$t <= 3s\$, and then remains constant for the remainder \$t > 3s\$.
Crucially, the area under these graphs is equally trivial to calculate, since the first interval is a right triangle, and the second is a rectangle. The question remains as to why these areas represent energy (also known as "work done" or simply "work").
The definition of power is "work done per second". If power was constant, and you needed to calculate the work done over a period of tens seconds, you could simply multiply power by time. Intuitively, then:
$$ W = P \times \Delta t $$
Frequently this is written with power P as the subject, which better illustrates the description of power being "work done each second":
$$ P = \frac{W}{\Delta t} $$
I reiterate, this is a simple calculation if \$P\$ is constant during the interval of time \$\Delta t\$, but in our case we are talking about \$p(t)\$, which is not constant, as is clear from the third graph, and we need to employ other methods to calculate the total work done.
In the general case where \$p(t)\$ has some arbitrary shape, we can treat the relationship \$ W = P \times \Delta t \$ in the following way. With independent variable \$t\$ on the horizontal axis, and dependent variable \$p\$ plotted as some position above or below, on the vertical axis, it might look like this (the blue line):
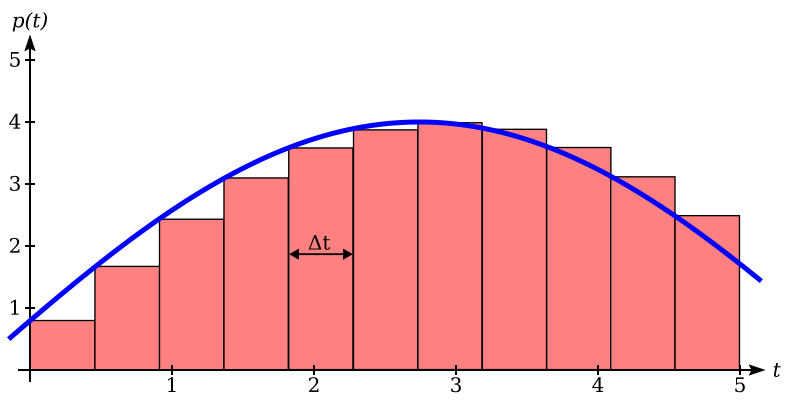
For each small interval \$\Delta t\$, the work done during that interval is approximately \$W \approx p(t) \times \Delta t\$, which is effectively the area of the rectangle with height \$p\$ and width \$\Delta t\$. This is only an approximation, since the value of \$p\$ will have changed during the interval. So, the total work done during the entire interval \$ 0 \le t \le 5s\$ will be approximately the sum of the areas of all the rectangles shown in red here.
As I'm sure you will have noted already, this amounts to the total area under the graph. In other words, the area under the graph of power vs. time equals work done.
We can get a better approximation by making \$\Delta t\$ smaller:
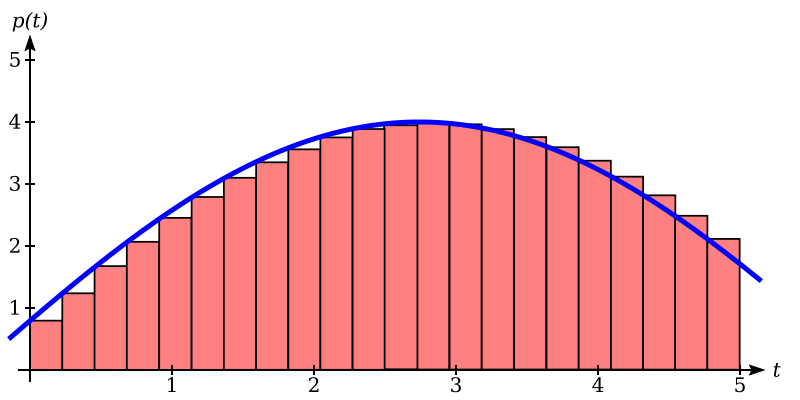
As \$\Delta t\$ gets smaller, the corresponding change in \$p\$ is also smaller, and the rectangle becomes a better approximation of the area under the curve during that interval. By reducing \$\Delta t\$ to some infinitesimally small value, as close to zero as it's possible to get without actually being zero, the sum of all these areas will be as close as it's possible to be to the actual total area under the curve. That's the premise underpinning integral calculus.
It's why we say that the area under the curve of power vs. time is equal to work done. The "area under a curve" is a colloquial way of saying "the integral of the curve's function (\$p(t)\$ in this case). Formally, the relationship between work done (energy) and power is written like this:
$$ W = \int{p(t) \cdot dt } $$
This says "work done is the sum of the values of \$(p(t) \times \Delta t)\$ evaluated over some interval of time, where \$\Delta t\$ is tiny and represented by the term \$dt\$".
Given that the the area under the power curve is "work done", or energy, and given also that the power curve in your case consists of two geometrically primitive regions, calculating the work done is a simple case of finding the areas of the triangular and rectangular regions, and adding them.
The triangular region (left) has area \$A_L = \frac{1}{2} \times 3s * 8W = 12J\$. The rectangular region (right) has area \$A_R = 3s \times 4W = 12J\$. Their sum is the total work done, \$W\$:
$$ W = A_L + A_R = 12J + 12J = 24J $$
The calculation could also be performed algebraically, if we had equations describing those two regions. That's not so hard to derive. The right-hand "rectangular" region in the interval \$3s < t \le 6s\$ is trivial to represent algebraically:
$$ p(t) = 4W $$
The left-hand region, \$0 < t \le 3s\$, isn't too hard either. It's a straight line through the origin. All we need is the gradient (slope) of that region, to build a linear equation of the form \$y = mx + c\$. Intercept \$c\$ is zero, and gradient is rise over run \$m=\frac{8W}{3s}\$. Thus this relationship is:
$$ p(t) = \frac{8}{3}t + 0 = \frac{8}{3}t $$
Let's integrate over the interval \$0 < t \le 3s\$:
$$
\begin{aligned}
W_{L} &= \int_{t=0}^{3}{\frac{8}{3}t \cdot dt} \\ \\
&= \frac{8}{3} \int_{t=0}^{3}{t \cdot dt} \\ \\
&= \frac{8}{3} \left[\frac{t^2}{2}\right]_{t=0}^{3} \\ \\
&= \frac{8}{6} \left[t^2\right]_{t=0}^{3} \\ \\
&= \frac{8}{6} (3^2 - 0^2) \\ \\
&= \frac{8}{6} \times 9 \\ \\
W_{L} &= 12J \\ \\
\end{aligned}
$$
Now the right-hand region, \$3s < t \le 6s\$:
$$
\begin{aligned}
W_{R} &= \int_{t=3}^{6}{4 \cdot dt} \\ \\
&= 4 \int_{t=3}^{6}{1 \cdot dt} \\ \\
&= 4 \left[t\right]_{t=3}^{6} \\ \\
&= 4 (6 - 3) \\ \\
W_{R} &= 12J \\ \\
\end{aligned}
$$
Their sum is the total energy received by the component:
$$
\begin{aligned}
W &= W_L + W_R \\ \\
&= 12J + 12J \\ \\
W &= 24J \\ \\
\end{aligned}
$$
As you can see, algebraically we get the same result as you would get by finding the area under the curve geometrically.

