I'm simulating a circuit and I obtained the AC simulation (bode plot) of it. However, now I want to plot the group delay, meaning, the negative derivative of the phase in terms of frequency. Is there a way to do that?
1 Answer
The easiest answer is to move your mouse over the right Y-axis until it becomes a ruler, right-click on it, then select Group Delay from the dialog.
The other, more complicated and not very useful way is to edit the waveform plot by right-clicking on the trace's label (e.g. V(out)), and then modify it like this:
d( -atan( im(V(out)) / re(V(out)) ) )/ (2 * pi)
Note that atan2() is not recognized, and d() is only recognized in the waveform arithmetic. You will also need to use a linear scale for the Y-axis if you want proper readings. See more in the help under LTspice > Waveform Viewer > Waveform Arithmetic.
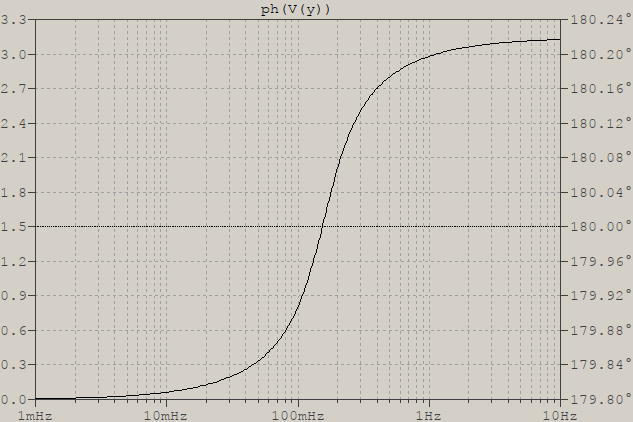
In case the expression above is too much, there is a shorter alternative, ph(), which calculates the phase, directly, without the need for atan(). It's useful for plotting the phase delay, but it won't work with d(ph()). Be careful, though, that the result will seem wrong, as if having a changed sign:
You have to remember that LTspice plots magnitude, not amplitude, and so the phase will show 180o, which means the result has the correct polarity, it's just that the display is awkward. See this for a similar problem.
Also, the value on the Y-axis will depend on whether Control Panel > Waveforms > Use radian measure in waveform expressions is checked or not. Default is unchecked, IIRC.
-
1\$\begingroup\$ Thank you! I did not realize I can change "Phase" to "Group Delay" on LTSpice. \$\endgroup\$ Commented Oct 23, 2020 at 9:23

