0
\$\begingroup\$

I want to make a noise measurement with my scope, but I need it to be band-limited.

I am using a Tektronix TBS1102, which allows me to save to a USB flash drive an Excel/CSV file with the X and Y values displayed on the screen. I can't get the output directly from the scope's ADC, but rather at the output of the signal displayed "on the screen" which has already been downsampled.

After I export this file, I import it into MATLAB so I can apply a digital FIR filter to limit the bandwidth, and then I am able compute the RMS value of the bandlimited noise.

The problem is that, as you know, scopes decimate the samples to be able to print them on the screen, my scope exports the Y values in a file with 2500 samples regardless of the time interval chosen for the horizontal scale.

My question is: does the sample rate, and therefore, the Nyquist frequency of the "screen" signal which is exported to the file, simply the inverse of the time span divided by the number of samples? Let me make an example to explain it better:

If the horizontal time interval is 0.5s, and the total file length is 2500 samples. This would mean that the sample rate would equal 5KHz, which would allow a maximum measured frequency of 2.5KHz, is the frequency content of the signal I am measuring actually band-limited to 2.5KHz? it doesn't seems to me to be band limited, because this would mean that the signal reduces its amplitude as you zoom-out the horizontal scale, and this clearly doesn't happen.

So what is the solution here? Select a smaller time span so the sample rate produces a higher Nyquist frequency than the one I am trying to limit the noise?

I guess that it all boils down to: what is the sample frequency of the signal displayed on the screen and the highest frequency of the signal being measured?

The oscilloscope is 1Gs/s with a 100MHz bandwidth, it doesn't have an RS232 or USB port

\$\endgroup\$
5
  • \$\begingroup\$ What sample memory depth is the scope set to? \$\endgroup\$
    – Hearth
    Commented May 17, 2022 at 3:36
  • \$\begingroup\$ Once you acquire a trace in your targeted time setting. increase the time setting to see the full extent if the saved trace. if this is e.g. 10us long, you know that there is 1 sample per 4 ns, i.e. every 4th conversion result is being outputted \$\endgroup\$
    – tobalt
    Commented May 17, 2022 at 4:43
  • \$\begingroup\$ Have you read the manual? It has a table describing what sample rate is used at which time base. \$\endgroup\$
    – Justme
    Commented May 17, 2022 at 18:25
  • \$\begingroup\$ @Justme Thank you, I didn't see that before. But that is not really what I am asking. What I am asking is, what is the sample rate of the signal printed at the screen? Is it the same? \$\endgroup\$
    – S.s.
    Commented May 17, 2022 at 23:39
  • \$\begingroup\$ Ok, I think I just found the solution. I believe it is like Justme says, that the sample rate of the manual is the same sample rate of the screen. I will add an analog low-pass filter with a very low noise amp like the AD797 as an anti-alias filter. Then, I will further process it in MATLAB. Thank you. \$\endgroup\$
    – S.s.
    Commented May 18, 2022 at 0:16

2 Answers 2

1
\$\begingroup\$

You will always get a buffer of 2500 samples, but the sampling rate used depends on the timebase used.

The exact sampling rate values for timebases are listed in the manual.

\$\endgroup\$
0
\$\begingroup\$

It would appear the TBS1102 is not a suitable scope for what you want to do:

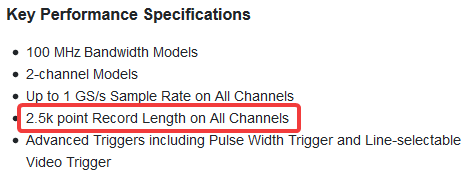
enter image description here

(from here)

2.5 kpoint record length means it will only ever record 2500 data points, which is either a limitation of the software the scope runs, or of the hardware--it may only have enough sufficiently-fast RAM to record 2500 data points in a single trigger.

Regardless of the reason, though, it doesn't look like there's any way to get this particular scope to give you any more points than that. If you have access to a higher-end or even just more recent scope, try one of those--models with Mpoints of memory are now common, and some expensive scopes even have over a Gpt.

\$\endgroup\$
4
  • \$\begingroup\$ Well, honestly I don't need many points, nor a big time span, what I need is to know how to determine exactly the highest frequency being measured, namely, the Nyquist frequency, is it simply the data points divided by the time span? The bandwidth to measure is really small, it goes from 600 Hz to 6KHz. I don't need anything fancy. \$\endgroup\$
    – S.s.
    Commented May 17, 2022 at 4:26
  • \$\begingroup\$ When you look at the scope screen, it usually says what is the sampling rate used to capture data, in addition to the standard time per division and voltage per division info. It is likely to be that value. \$\endgroup\$
    – Justme
    Commented May 17, 2022 at 4:58
  • \$\begingroup\$ @Justme If it only were that simple... my scope does not provide this information on the screen \$\endgroup\$
    – S.s.
    Commented May 17, 2022 at 17:37
  • \$\begingroup\$ @S.s. Indeed. But the manual does. \$\endgroup\$
    – Justme
    Commented May 17, 2022 at 18:25

Your Answer

By clicking “Post Your Answer”, you agree to our terms of service and acknowledge you have read our privacy policy.

Not the answer you're looking for? Browse other questions tagged or ask your own question.