0
\$\begingroup\$

I've been building a test stand for ultracapacitors, with very simple schematic looking like this:
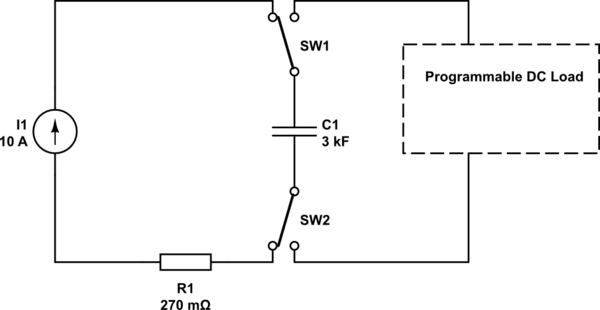
schematic

simulate this circuit – Schematic created using CircuitLab

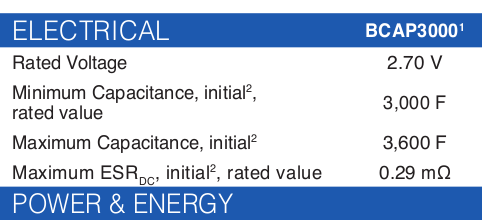
The resistor on the bottom is to enable the source to push the load through the cap while it's discharged as it's internal resistance is too low for short-circuit-protected source to work. Programmable load is also further connected to a PC that lets me read the current and voltage values during discharge. The ultracap is Maxwell's BCAP3000 2,7V.

I discharged the ultracap with stable 10 Amps and what I've noticed is that there is a voltage drop immediately when discharge starts. My question is what is the cause of that voltage drop? Voltage drops from 2,7 to about 2,45 V. The characteristic of discharge looks like this: 2,7V discharge
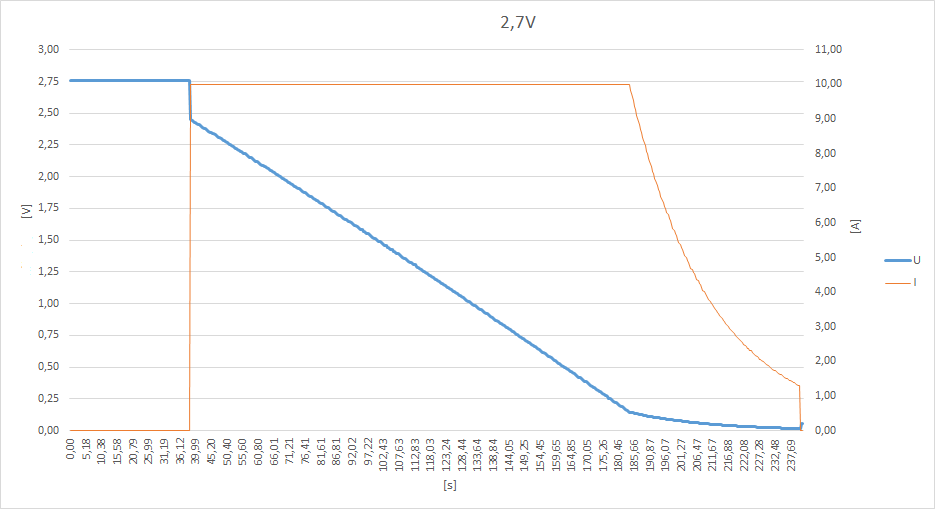
Also, should I be concerned about the linearity of the characteristic? I think it is linear because I used the CC method rather than CV where it would drop exponentially.

\$\endgroup\$
4
  • 1
    \$\begingroup\$ Voltage should 'jump' back up when discharging stops before the cap is 'empty'. The voltage drop which happens only when current flows is due to ohmic resistance, i.e. the ESR of the cap and other parasitic resistances. \$\endgroup\$
    – JimmyB
    Commented Jun 24, 2019 at 10:33
  • \$\begingroup\$ What is the cause of such jump? Is it because inside the capacitor ion and electrons reconfigure or it's caused by some reverse flow of charges? It is barely visible in the right corner of the characteristic I did. \$\endgroup\$
    – QST
    Commented Jun 24, 2019 at 10:54
  • 1
    \$\begingroup\$ As I said: It is due to the resistance inside the capacitor and whatever wires/connections around it. Any resistance will (only) cause a voltage drop when/as long as current flows; when the current stops, that voltage drop 'disappears'. \$\endgroup\$
    – JimmyB
    Commented Jun 24, 2019 at 11:31
  • \$\begingroup\$ Thank you for explaining. \$\endgroup\$
    – QST
    Commented Jun 24, 2019 at 11:32

2 Answers 2

2
\$\begingroup\$

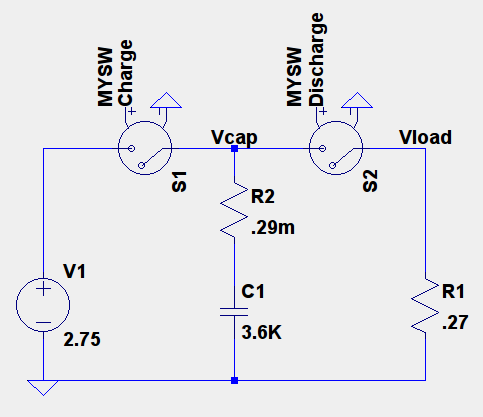
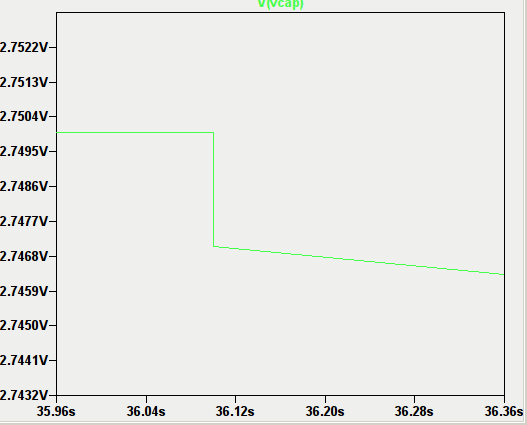
Using only the ESR from the datasheet (ideal wires...):

enter image description here enter image description here enter image description here

Current is practically zero before discharging and jumps to 10A, hence the drop. Initial linear discharge is expected due to constant current.

The larger drop you see is certainly due to wires, switches etc.

To be more specific, let's consider 3 steps:

  • charging: capacitor practically reached its max. voltage, current through ESR, from the voltage source, is mainly due to leakage (max 5.2 mA in the datasheet)
  • both switches opened: current through ESR is zero but capacitor is self discharging due to leakage (could be modeled by a 520 Ohm in parallel with the cap)
  • discharging: current through ESR follows the load current
\$\endgroup\$
4
  • \$\begingroup\$ The current you might expect before the discharge comes from ESR as it's a leakage current. Thank you for explaining the initial drop of voltage. \$\endgroup\$
    – QST
    Commented Jun 23, 2019 at 10:57
  • 1
    \$\begingroup\$ Leakage current (max 5.2 mA in the datasheet) is internal. An approximate model would be a 520 Ohm resistor in parallel with the capacitor. \$\endgroup\$
    – devnull
    Commented Jun 23, 2019 at 11:20
  • \$\begingroup\$ So if I understand correctly, during the short peak time while voltage drops, those 10 amps from DC Load go only through internal resistance and resistances of switches and cables, then load adjusts the internal resistance and characteristic gets less steep? \$\endgroup\$
    – QST
    Commented Jun 23, 2019 at 14:56
  • 1
    \$\begingroup\$ During discharge there is current in both internal resistances (series and parallel) but your discharge current is much larger. This means that the voltage slope during constant current discharge gives a good estimation of the real capacitance. There is a simplified schematic for DC electronic load (constant current) here: electronics.stackexchange.com/questions/256266/… \$\endgroup\$
    – devnull
    Commented Jun 23, 2019 at 15:33
1
\$\begingroup\$

If you change the device-under-test symbol to a capacitor with a series resistance, the curve will fit the depicted schematic. It's not quite that simple, there's perhaps some internal charge distribution nonuniformity, but an 'effective resistance' of 0.3V/10A = 30 milliohms makes the curve fit rather well.

\$\endgroup\$
1
  • \$\begingroup\$ Indeed it is the ESR of the capacitor, wires and connectors. \$\endgroup\$
    – Justme
    Commented Jun 23, 2019 at 8:07

Your Answer

By clicking “Post Your Answer”, you agree to our terms of service and acknowledge you have read our privacy policy.

Not the answer you're looking for? Browse other questions tagged or ask your own question.