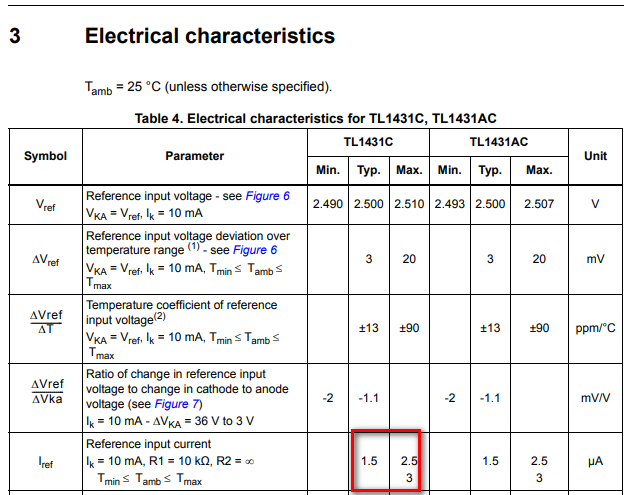
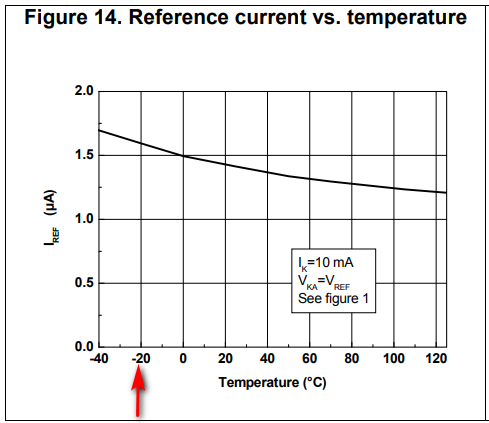
There appear to be some mismatch for Iref value between the table and the graph for part TL1431CL5T. In the table it specifies the maximum value as 3uA where as in the graph it specifies as 1.7uA at -40C and 1.6uA at -20C. Can anyone please explain why the values between the table and the graph are different?.
Many Thanks!

2 Answers
You have to recognize the difference between the typical values in a datasheet and the minimum and maximum values. The typical values are what you would measure in most of the parts and generally at room temperature. The minimum and maximum values are the guaranteed values that no part would exceed. In this case, the typical reference current is 1.5 ua as shown in the table at room temperature. The maximum value is 2.5 ua with no minimum specified. Over the full operating temperature range, the maximum could go as high as 3 ua. The graph is meant to show how the current varies over the temperature range for a typical part with a room temperature current of about 1.5 ua. If the actual reference current is different from typical (it could be higher and it could be lower), you would need to adjust the vertical scale to estimate how much the current would vary with temperature.
The graphs in datasheets, almost invariably, are representative of a typical device, not the maximum or minimum limits, unless they say otherwise. Most of these graphs are generated by actual measurements of randomly selected devices, and as such they give you an idea of how the typical device will perform.
The tables, on the other hand, are the guaranteed values. The manufacturer guarantees that the device will have an input current of less than 3 μA. The graphs don't guarantee anything--they just give you an idea of what behaviour to expect.

