update: Based one the comment from @Andy aka, I tried to obtain the curve without using the integrator. It does give me a better looking graph.
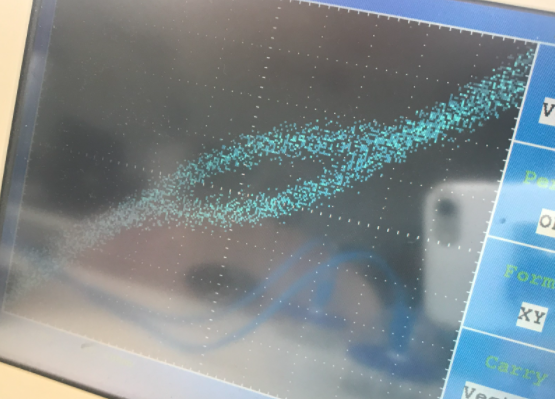
Afterward, I switched the power supply to another larger one (which I can gradually change the input voltage by turning a knob. However, this time the curve looks so fat and unconcentrated. Why is this happening? (other than this issue, the curve looks good!)**
________________________________________________________________________________________
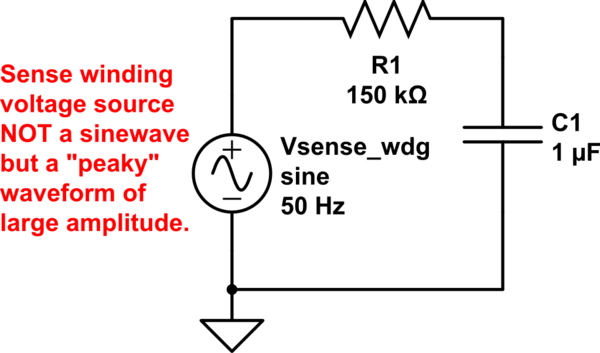
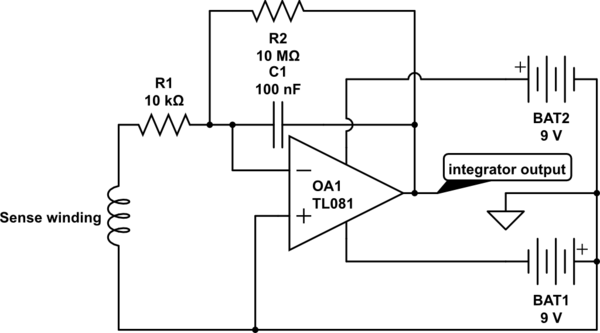
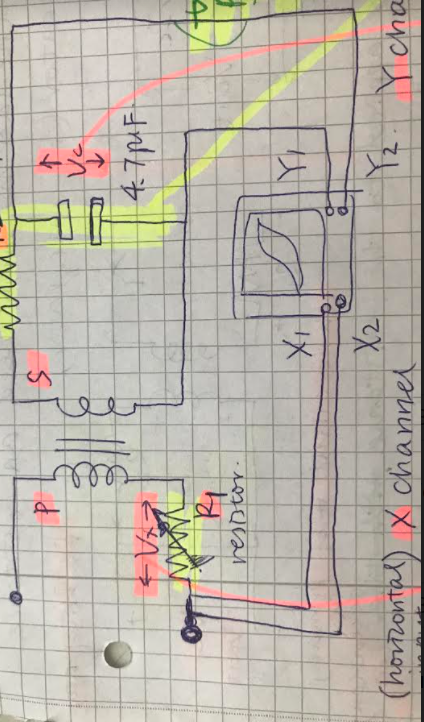
I am using a 600turns 2A - 300turns 4A step down transformer with an iron core, AC voltage of 3V, and an RC integrator consisting of a 47 microfarad capacitor and an 8 ohm resistor (I got this from a variable resistor)
This is my setup:
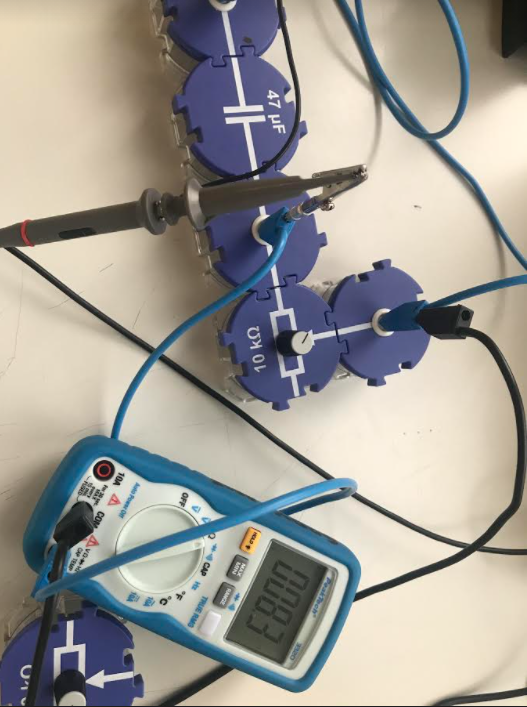 This is my circuit diagram:
****This shape of the hysteresis curve looks like this. I observed that as I increase the voltage, the shape of the hysteresis curve does not actually change. From what I see, it is probably only the size of it that is changing.
this is the curve I get when the input voltage is 1V. This looks the same as the one when the input voltage is 3V, but just a smaller in size...
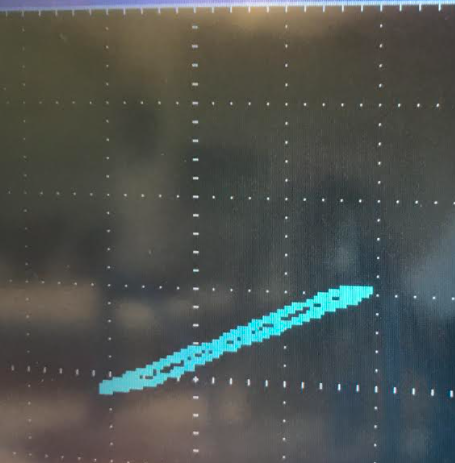
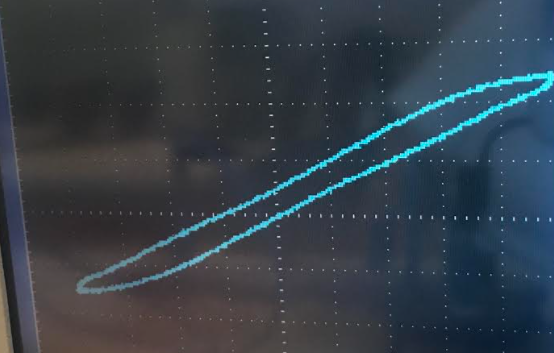 This might be why that I cannot get a saturation point on the curve...Why is this happening, how can I correct this?
I am unsure about why the curve looks round. I increased the voltage up to 15V. However, the curve still has not yet reached saturation.
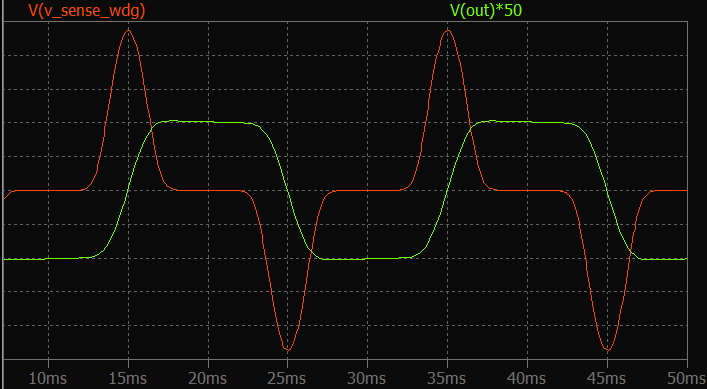
I was expecting to see a curve like this when the curve has not yet reached saturation:
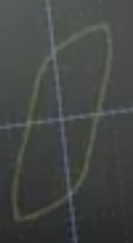
Also, the resistance of the resistor in the integrator is currently 8 ohm. If I increase it, for example, to 122 ohm, the shape turns really round like this:
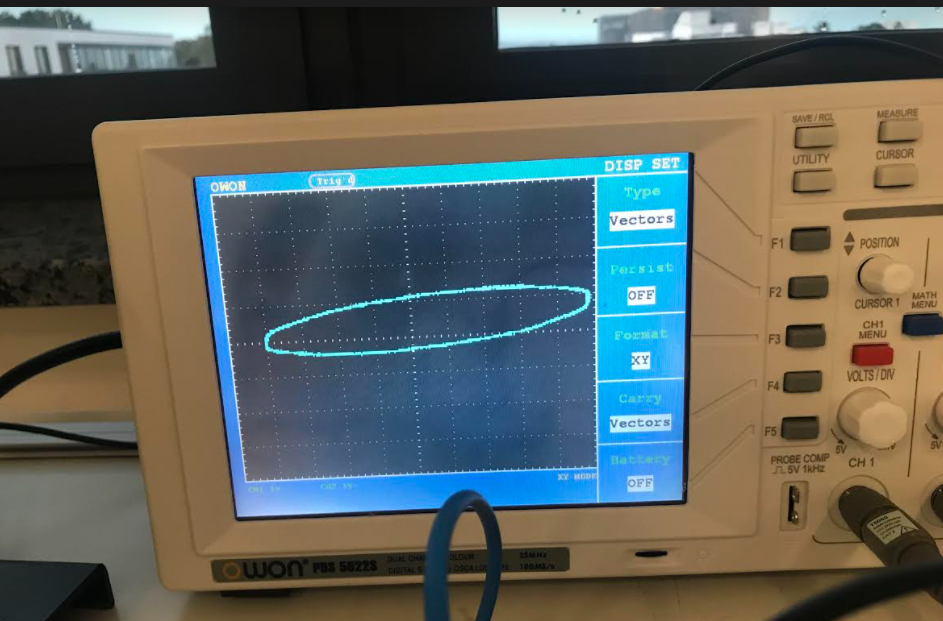
Where is the mistake..?

