0
\$\begingroup\$

According to the IRF740 data-sheet from IR or from Vishay (they are nearly the same, the Vishay is better to read), the Qg is specified as 63nC under Id = 10A Vds = 320V and Vgs = 10V.

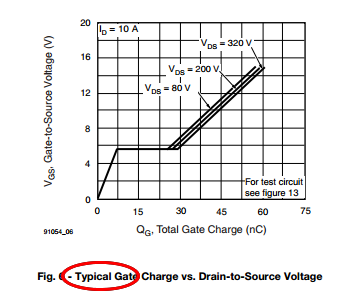
But at page 4, Fig. 6 - Typical Gate Charge vs. Drain-to-Source Voltage, The graph shows that under the same conditions the Qg is ~45nC. Its 63nC at a Vgs = ~15V.

Is the data-sheet that have a error or I'm interpreting it wrong?
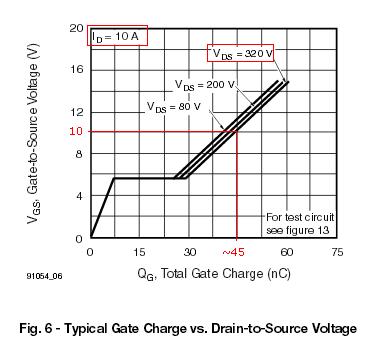
Typical Gate Charge vs. Drain-to-Source Voltage graph

\$\endgroup\$

2 Answers 2

1
\$\begingroup\$

Sorry, but you're interpreting it wrong. The 63 nC is a maximum figure, while your graph shows typical Qg - which is, as you might expect, less than the maximum.

\$\endgroup\$
0
2
\$\begingroup\$

The value in the table is a maximum value.

The curve in the chart is a typical characteristic.

The charts almost always show typical values, not specification limits.

I assumed the graph showed the maximum value too

enter image description here

\$\endgroup\$
6
  • \$\begingroup\$ As it generally better to dimension the gate-drive for the worst case, I assumed the graph showed the maximum value too. Anyway that's just talking about the data-sheet, thanks for the answer. \$\endgroup\$ Commented Feb 10, 2015 at 4:55
  • \$\begingroup\$ It's on page 3, the title of the section of the datasheet that contains all the charts is "Typical Characteristics". \$\endgroup\$
    – The Photon
    Commented Feb 10, 2015 at 4:56
  • \$\begingroup\$ Yes, even that's only present at the Vishay datasheet, the graph itself says "Typical Gate Charge vs. Drain-to-Source Voltage". \$\endgroup\$ Commented Feb 10, 2015 at 5:01
  • \$\begingroup\$ As the graph seems linear above certain Vgs (but this is a so dynamic property), would interpolating between the max/typical value at Vgs = 10V to get the maximum value at Vgs = 15V or some common safety margin? \$\endgroup\$ Commented Feb 10, 2015 at 5:15
  • \$\begingroup\$ @DiegoCNascimento 1. You say " ...Yes, even that's only present at the Vishay datasheet, ..."-> NO both data sheets make it clear what is max and what is typical. 2. Also, graphs are always typical unless stated otherwise. 3. This is engineering !!!!!!!!!!! 45 = = 63 = = 50 == 45 ==70. ie you are extremely unlikely to have to have the sort of precision you are aiming at in Q. \$\endgroup\$
    – Russell McMahon
    Commented Feb 10, 2015 at 5:22

Your Answer

By clicking “Post Your Answer”, you agree to our terms of service and acknowledge you have read our privacy policy.

Not the answer you're looking for? Browse other questions tagged or ask your own question.