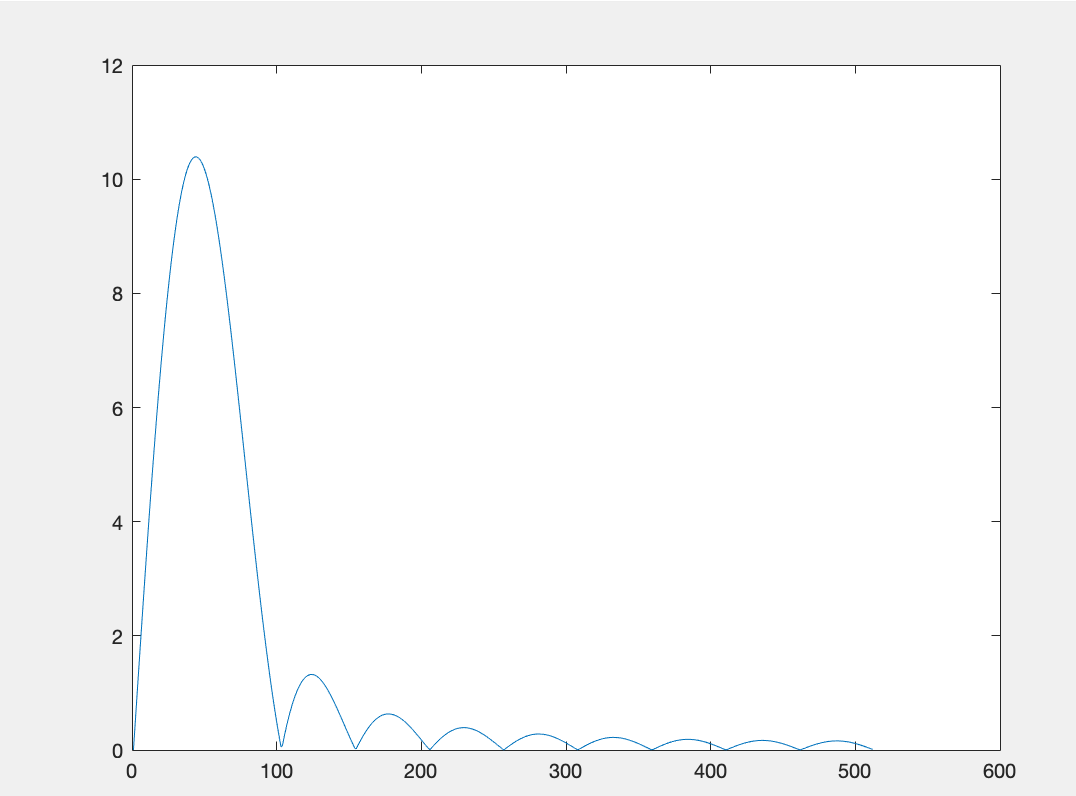
As @MarcusMüller indicated, you need to use fft instead of freqz:
Replace h1=freqz(s1); with h1=fft(s1)/Np;
Also, to interpret the result, it would be better to replace plot(abs(h1)); with stem(n,abs(h1));.
In your example, the signal is exactly one period of a sine wave with amplitude 1, so you should get a spike at n=1 and n=19 with amplitude one half. The amplitude of 1 is split over two frequencies. The n=19 corresponds to a negative frequency n=-1 (a sine wave is the sum of two complex exponentials, one with a positive frequency and one with a negative frequency: \$\sin(\omega t) = \frac{1}{2 j}(e^{j \omega t} - e^{-j \omega t})\$).
If you would want to plot a single-sided FFT (this has only positive frequencies and would provide an amplitude of one at n=1 in your example), have a look at the Matlab documentation for fft, example Noisy Signal.


freqzand not justabs(fft)? \$\endgroup\$