4
\$\begingroup\$

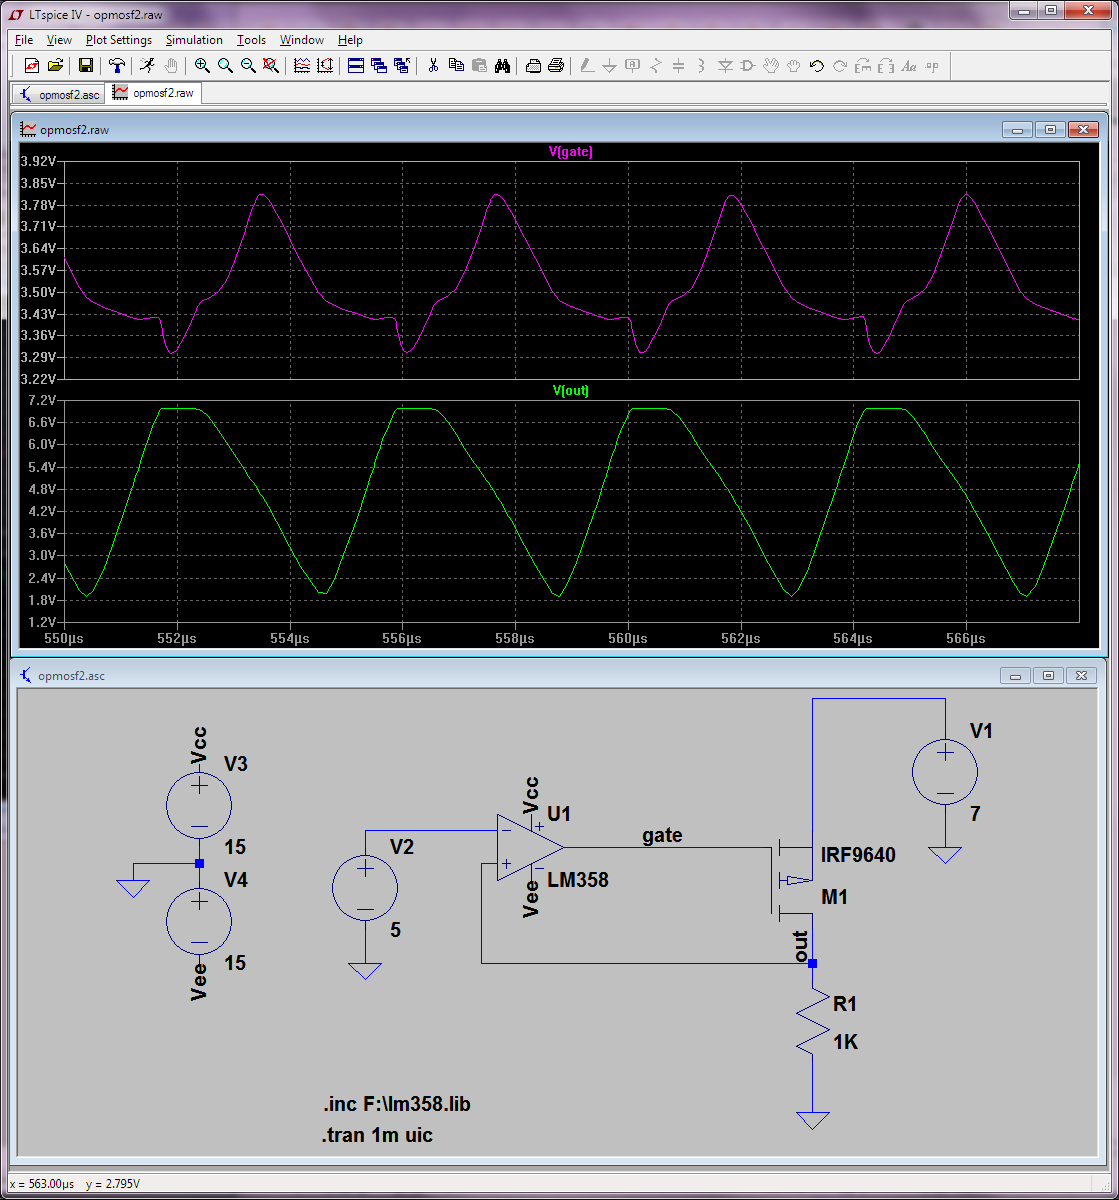
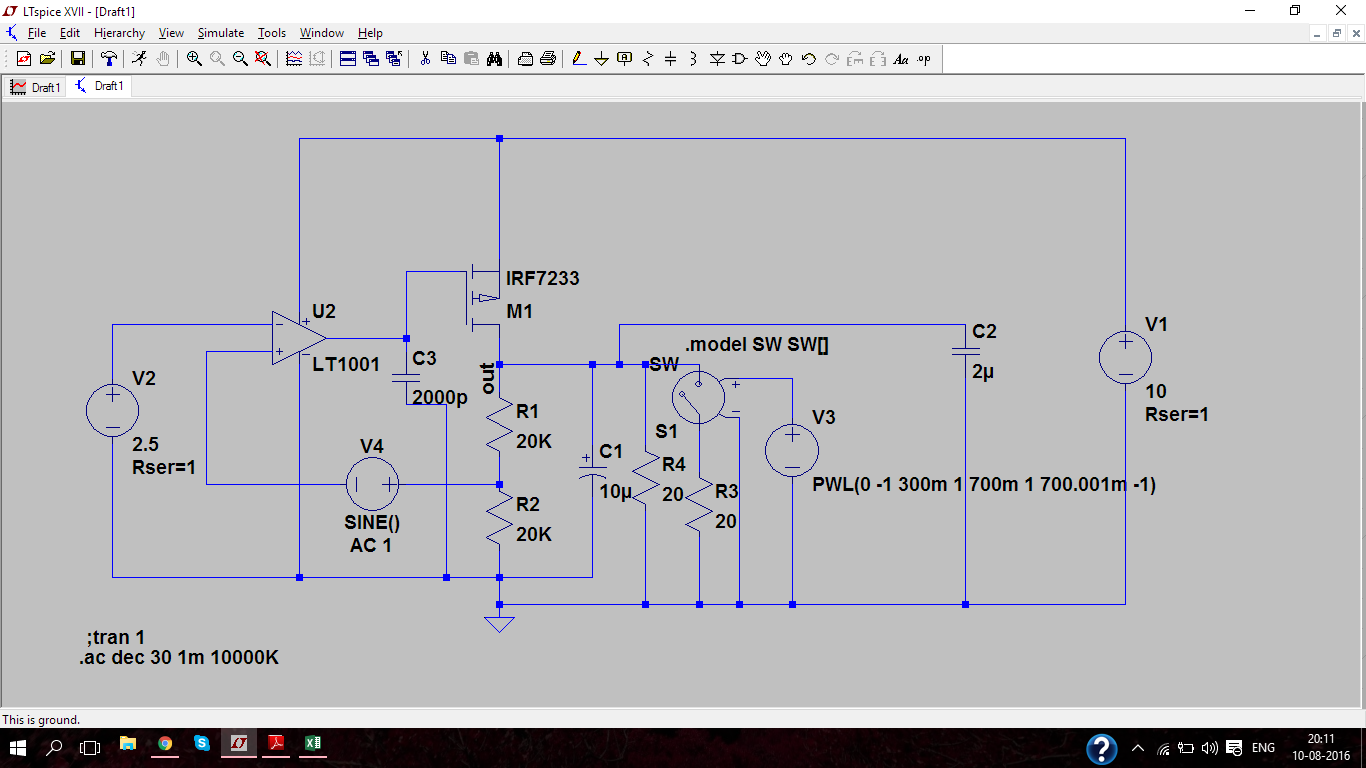
I'm somewhat familiar with using LTspice to do phase margin analysis for a classic i.e. obvious negative feedback path opamp circuit; in fact I've done that analysis successfully for fixing real opamp circuits. But I'm confused how to do this properly for the kind of circuit that is the core of a PMOS LDO. The circuit is actually based on another EE.SE question, which I could answer/fix with some cookbook knowledge of what works for such circuits. But I'm now trying to understand better how the fix worked. (Also, in this circuit there's no voltage divider for the reference voltage, so it's just a follower, which is unlike an actual LDO.)

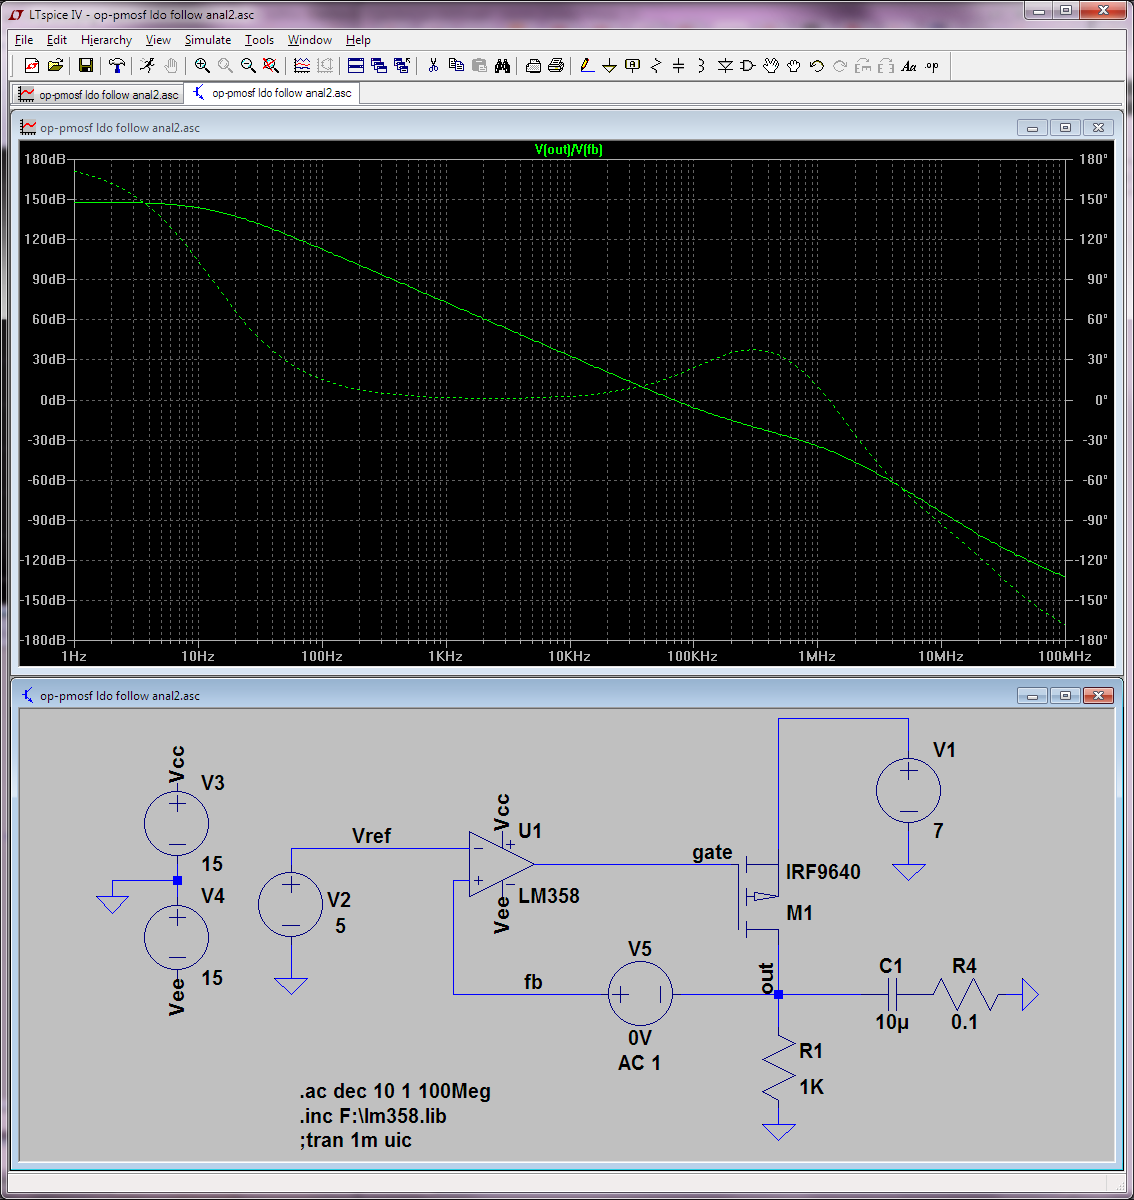
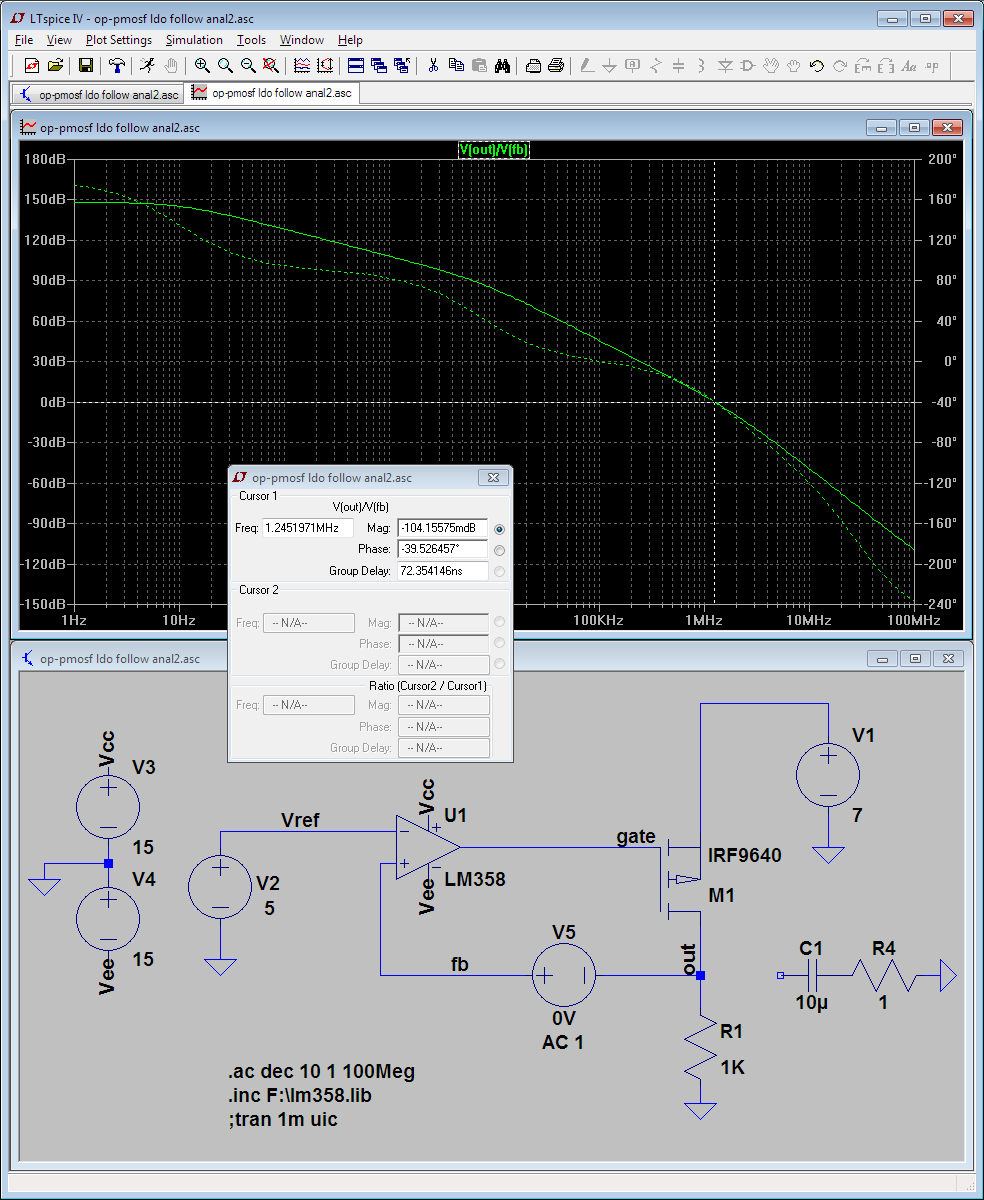
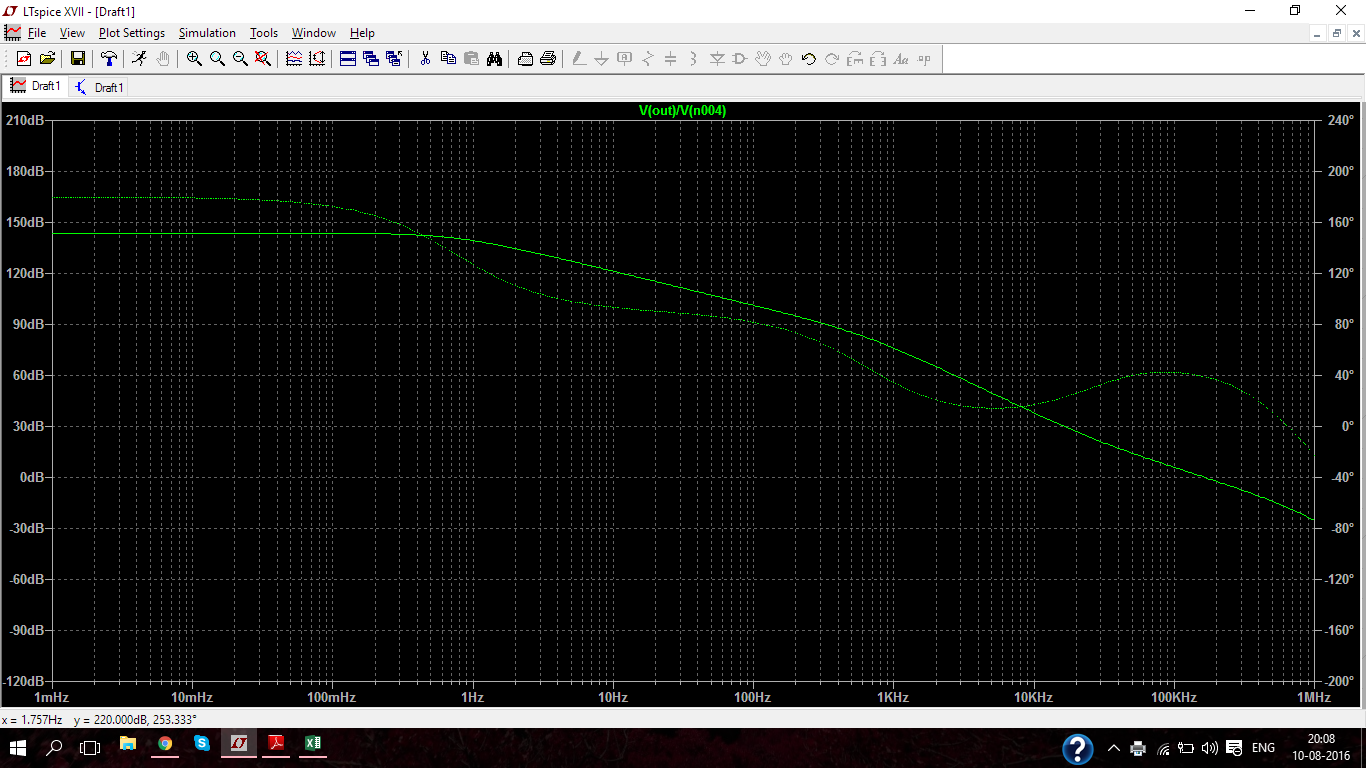
In this type of circuit the positive feedback pin of the opamp receives the obvious feedback, but this is already out of phase, so it's negative positive feedback, LOL. It seems to me that since I can't meaningfully cut the feedback loop where I normally do it, i.e. at the negative input pin of the opamp, I should do it at the positive one. So I've done that and added a 0V DC but 1V AC stimulus as per the usual procedure. But the result I get doesn't seem to indicate any instability at all...

enter image description here

... which is quite in contrast with the transient simulation (and the real [uncompensated] circuit behavior from the other question).

enter image description here

A few extra notes: I've tried zeroing V2 but makes little difference and if possible I'd prefer to keep the DC point as close the real circuit as possible. Also the fix/compensation cap and its ESR resistor are purposefully disconnected above [so I can see the unstable circuit's bad phase margin], although if I connect them I can't see any amazing difference but the phase does stay higher for longer.

enter image description here

So what am I doing wrong in terms of phase margin analysis here?


A few more notes:

\$\endgroup\$
9
  • \$\begingroup\$ I'd say you are injecting a much too large AC voltage, use a lower one like 10 mV or something. I've actually done something very similar during my master course, let me have a look at what I did there. Or you can have a look as well. \$\endgroup\$
    – Arsenal
    Commented Nov 25, 2015 at 18:34
  • \$\begingroup\$ Oh, I tried 0.1V and even 0.01V AC. Same result. \$\endgroup\$ Commented Nov 25, 2015 at 18:48
  • \$\begingroup\$ Had a look and I've used something quite complicated (with which I didn't come up with) called the double injection technique. I'm sort of disgusted of myself on how little I know of what I did there... I guess I'll have to reiterate the whole thing to compile it into a usable answer here. But the simulation files should give you the possibility to inspect the approach and try if you get usable results. \$\endgroup\$
    – Arsenal
    Commented Nov 25, 2015 at 18:48
  • 1
    \$\begingroup\$ @Arsenal: Ok, I've read your paper and looked at your simulations... and hacked them to use LT's simpler method for comparison. And the good news is that I get basically the same results as far as phase margin is concerned. Tian et al.'s double-injection method you used is souped-up version of Middlebrook's method ... and even the latter is a bit overkill for these circuits if you break the loop before the opamp. Here are some screenshots validating LT's method with the phase margins found using for those 3 ESR values from your paper: imgur.com/a/NH3Tp \$\endgroup\$ Commented Nov 26, 2015 at 12:12
  • 1
    \$\begingroup\$ Middlebrook method assume that the feedback path is unilateral, whereas Tian et al. assume it bilateral. However for this kind of circuit the latter refinement makes zero difference; the two graphs (for AC1 vs. -1) completely overlap as you probably noticed. \$\endgroup\$ Commented Nov 26, 2015 at 12:20

4 Answers 4

5
\$\begingroup\$

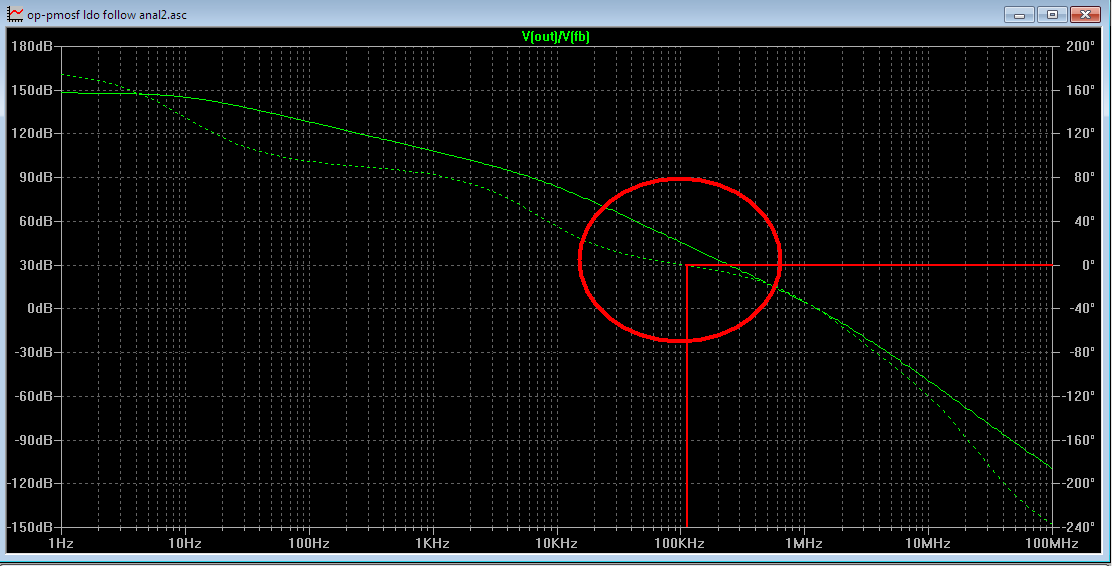
I think the top graph does indicate exactly where instability occurs: -

enter image description here

The phase angle is zero degrees and the gain is still +45 dB. In other words it's "gain margin" that is causing oscillation here.

The transient graph seems to indicate it oscillating at 250 kHz whereas the AC graph tells me it could oscillate at 100 kHz. This doesn't surprise me given the amount of gain margin (45 dB).

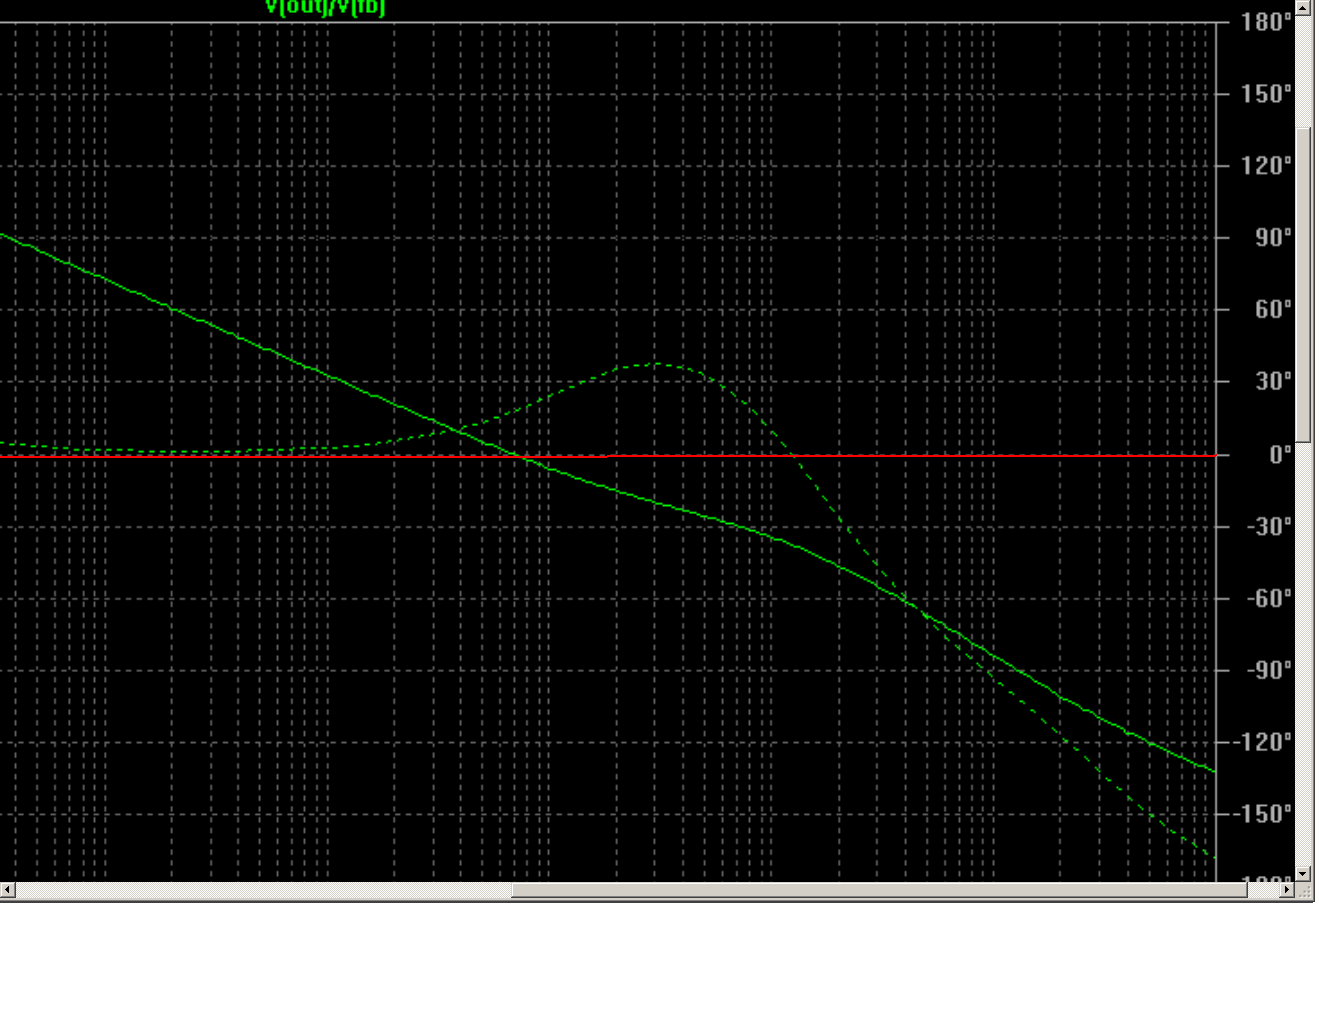
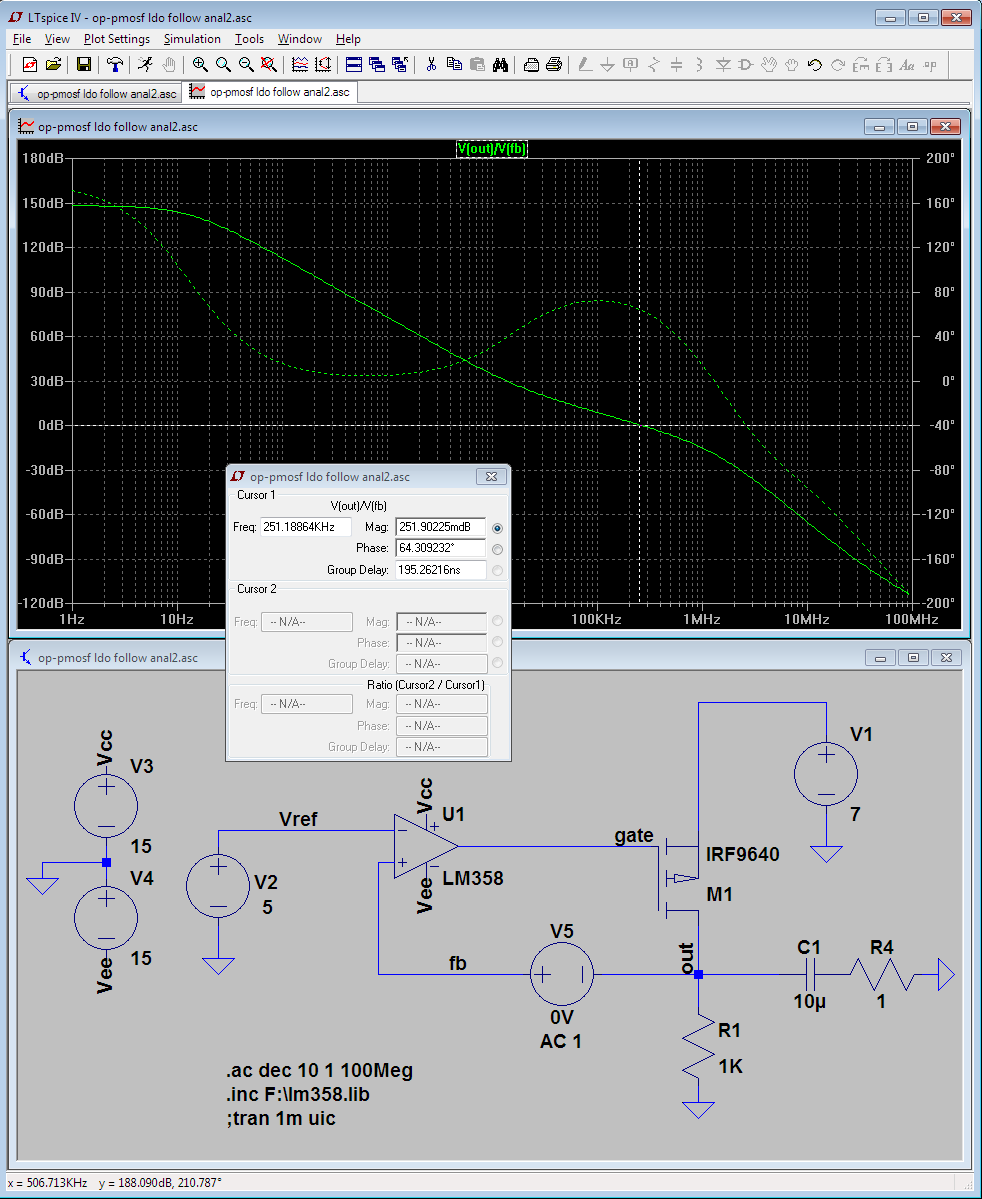
The compensated response is borderline unstable in the trough area but not quite totally unstable. I would imagine there would be a fair degree of overshoot/ringing when subjected to transient supply or load changes: -

enter image description here

\$\endgroup\$
1
  • 1
    \$\begingroup\$ You are basically correct. I had a rather embarrassing moment of confusion, which was caused by the fact that I was reading a TI document on PMOS LDOs while I was doing this analysis. I got confused by the fact that TI plots the actual phase in the appnote whereas LT's method plots only the margin. So I was [incorrectly] expecting the LT graph [for the uncompensated circuit] to well hit -180 degrees at 0dB. But I saw only about -40 degrees in my LTspice plot. However that's just the margin, meaning the phase is actually -220 degrees! \$\endgroup\$ Commented Nov 26, 2015 at 13:31
2
\$\begingroup\$

So to further explain/fix my confusion with some graphs, the injection method used here plots the actual phase margin not the absolute phase. So if the phase margin is above 0 degrees (at 0dB), that's the absolute stability threshold; that zero degrees phase margin corresponds to an absolute phase of -180 degrees. Some other publications and software plot stability in terms of the absolute phase, not the margin, so I got confused...

Here are two plots that obviously show first obvious instability/oscillation (minus 40 or so degree phase margin) and stability (plus 60 degrees phase margin; I've upped the ESR to 1 ohm for that compared to my initial-post fix). These graphs are mostly duplicative of what Andy said, but they use the same criterion (phase margin), so they are easier to compare.

enter image description here

enter image description here

\$\endgroup\$
1
\$\begingroup\$

Even though you found your answer, I thought I share this:

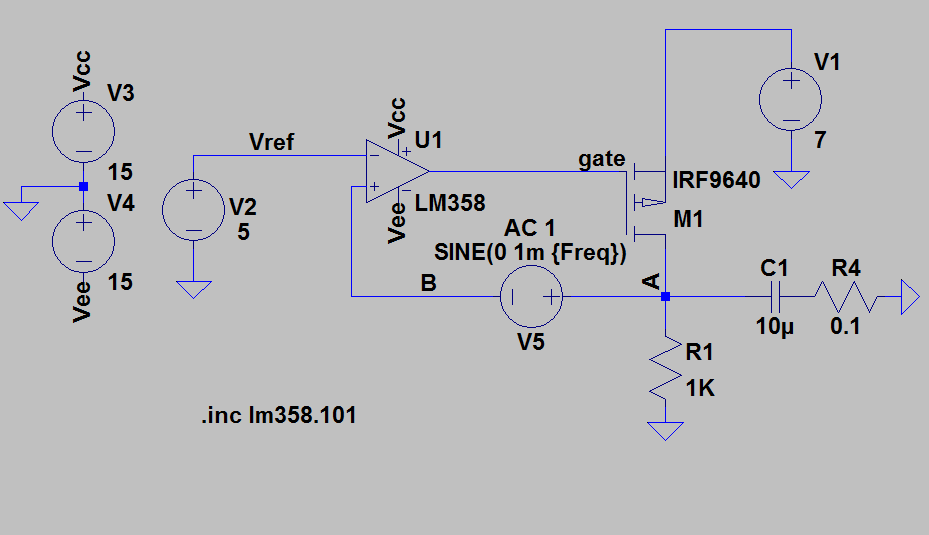
I've learned a different approach to AC analysis in the last LT-Spice seminar, which is based on multiple transient simulations and calculating the phase and gain with measurement statements. This is useful for switchmode supplies (the LT switchers are time domain models), and I tried to apply it to your circuit as well.

It didn't go all that well, but it might be helpful for other applications.

enter image description here

So instead of using a small signal AC voltage source, you use a "normal" transient sine voltage source, with a parametrized frequency.

It was recommended to use the alternate solver (settable in the options) to increase the results precision.

Then you have to place some Spice directives to get it working:

.param Freq=125K ; iterate to 0dB gain or use the .step statement below
.step dec param freq 1 10meg 5
.save V(a) V(b)
.option plotwinsize=0 numdgt=15

The .save statement tells LT-Spice which nodes to save, so it's reduced to only the interesting nodes A and B. The .option statement increases precision and turns off the lossy compression of the results. As you will perform a number simulations, don't choose to many points in your .step statement, for a simple circuit like this, the above works okay, but in a switchmode one, you probably use less.

Next are measurement statements:

.measure Aavg avg V(a)
.measure Bavg avg V(b)
.measure Are avg  (V(a)-Aavg)*cos(360*time*Freq)
.measure Aim avg -(V(a)-Aavg)*sin(360*time*Freq)
.measure Bre avg  (V(b)-Bavg)*cos(360*time*Freq)
.measure Bim avg -(V(b)-Bavg)*sin(360*time*Freq)
.measure GainMag param 20*log10(hypot(Are,Aim) / hypot(Bre,Bim))
.measure GainPhi param mod(atan2(Aim, Are) - atan2(Bim, Bre)+180,360)-180

Basically magnitude and phase are calculated. Note the use of ...Mag and ...Phi, LT-Spice will recognize these as complex data and will plot them accordingly.

Lastly the simulation command:

.param t0=.2m
.tran 0 {t0+25/freq} {t0}

The parameter t0 is for giving the circuit some time to settle (or ramp up) before data is saved. The simulation time is dependent on the frequency, so that 25 periods are simulated.

After simulating this, the interesting results are in the Spice-Log (Ctrl+L). If you rightclick and select "Plot .step'ed .meas data" it will ask you if it shall interpret the Mag and Phi as complex data, which you of course want.

The result looks like this then: enter image description here

Which is quite close to what you got with the AC analysis.

If you disconnect the output capacitor, things start to go wrong, I guess this approach has troubles if your system is not stable: enter image description here

\$\endgroup\$
2
  • \$\begingroup\$ They have some public documentation on this method too: linear.com/solutions/4673 (Let me actually read the rest of your post before I say anything else.) \$\endgroup\$ Commented Nov 26, 2015 at 16:06
  • \$\begingroup\$ @RespawnedFluff and even more here... Seems like a good page to have in the bookmarks, those LT Solutions. \$\endgroup\$
    – Arsenal
    Commented Nov 26, 2015 at 16:15
1
\$\begingroup\$

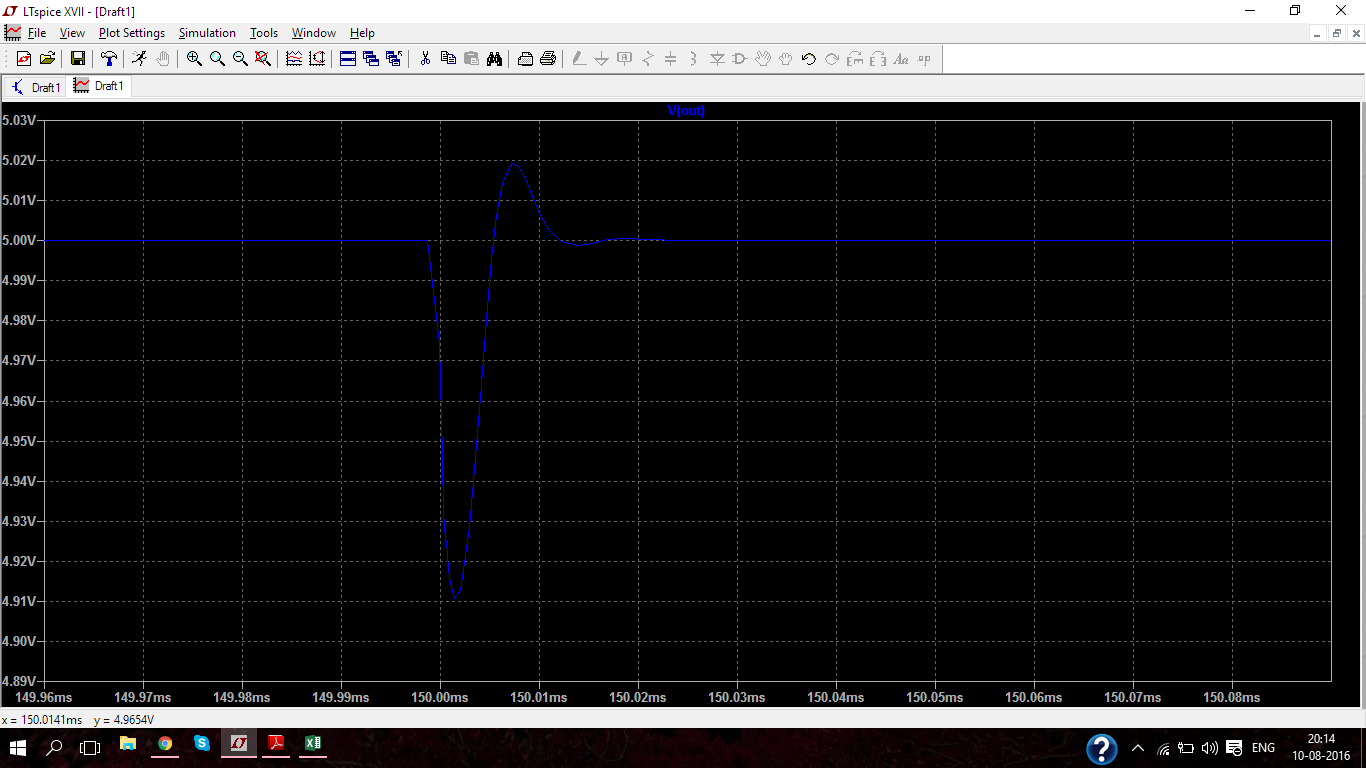
This is the stability plot i got when i simulated the same TI's document's LDO. You can see the PM is around 40db and this proves also in load transient responce.

The seen transient response is for 0-200mA step current.

enter image description here enter image description here enter image description here

\$\endgroup\$

Your Answer

By clicking “Post Your Answer”, you agree to our terms of service and acknowledge you have read our privacy policy.

Not the answer you're looking for? Browse other questions tagged or ask your own question.